
The financial markets have grown significantly, with the global stock market indices sector projected to reach $127 trillion in 2026. Indices are some of the most liquid and actively traded financial instruments in the world. Whether you are a beginner looking to understand the broader macroeconomic environment or an experienced trader aiming to capture massive cyclical moves, indices offer unique advantages over trading individual stocks.
In this comprehensive 2026 guide, we will explore the best indices to trade, how they function, the core benefits and risks involved, and the precise technical strategies you can use to stay on the right side of the market.
What are Stock Market Indices?
At its core, a stock market index is a method of measuring the performance of a specific group of assets or a whole stock market. Think of it as a basket of stocks. When you trade an index, you are not buying or selling a single company like Apple, Microsoft, or Nvidia. Rather, you are taking a position on the collective performance of dozens or hundreds of companies within that basket.
How Indices Are Weighted
To understand how to trade indices effectively, it is essential to understand how they are calculated and weighted:
| Index Type | Calculation Method | Prominent Examples | Market Share (2026) |
| Market Cap-Weighted | Based on the total market size of the companies in the index. | S&P 500, FTSE 100 | 71% |
| Price-Weighted | Based purely on the stock’s price, regardless of the company size. | Dow Jones Industrial Average, Nikkei 225 | 14% |
| Equal-Weighted | All stocks have the exact same influence on the index’s movement. | S&P 500 Equal Weight | 9% |
| Fundamental-Weighted | Based on fundamental economic metrics like revenue or book value. | FTSE RAFI | 6% |
Market capitalization-weighted indices dominate the modern trading landscape. In 2026, the concentration of the top ten constituent stocks in major indices reached 34%, meaning that monitoring these key industry leaders is crucial for index traders. Master the markets in 2026 by trading the top stock market indices with the precision of Elliott Wave Theory.
Top 10 Best Indices to Trade in 2026
When choosing an index to trade, liquidity, volatility, and access to macroeconomic news are the primary drivers.
| Index Name | Geographic Region / Market | Primary Sector Focus | Best Strategy Style |
| 1. S&P 500 | United States | Broad Market (Large-Cap) | Trend-Following & Swing Trading |
| 2. NASDAQ-100 | United States | Technology & Innovation | Momentum & Day Trading |
| 3. Dow Jones (DJIA) | United States | Blue-Chip Industrial/Financial | Value & News Trading |
| 4. DAX 40 | Germany / Europe | Manufacturing & Automotive | European Session Breakout |
| 5. FTSE 100 | United Kingdom | Commodities & Energy | Commodity Correlation Trading |
| 6. Nikkei 225 | Japan / Asia | Export & Corporate Tech | Asian Session Trend-Following |
| 7. CAC 40 | France / Europe | Multinational / Luxury | European Market Rotation |
| 8. STOXX Europe 600 | Europe | Broad European Diversification | Portfolio Swing Trading |
| 9. Hang Seng | Hong Kong / Asia-Pacific | Emerging Markets & Financials | Geopolitical / Macro Trading |
| 10. ASX 200 | Australia | Resources & Materials | Commodity-Linked Exposure |
In-Depth Details of the Top Indices
1. S&P 500 (US)
- What it is: Represents 500 of the largest large-cap companies in the United States and is considered the ultimate barometer of the US economy.
- Why Trade It: In 2026, the index surged toward the 7,100–7,600 range, bolstered by the AI infrastructure investments of major cloud computing companies. It is incredibly liquid and reacts predictably to monetary policy. Explore the top quantum computing stocks, balancing the speculative upside of pure-plays with the stability of diversified tech giants.v
- Best For: Trend-following and swing traders who prefer balanced market exposure.
2. NASDAQ-100 (US)
- What it is: Tracks 100 of the largest non-financial companies listed on the NASDAQ exchange.
- Why Trade It: This index is heavily dominated by technology stocks. Higher volatility and high-volume growth make it a favorite among active day traders.
- Best For: Growth-oriented traders and day traders seeking momentum.
3. Dow Jones Industrial Average (DJIA – US)
- What it is: A price-weighted index consisting of 30 blue-chip US companies.
- Why Trade It: The Dow remains one of the most widely recognized barometers of traditional industry, banking, and manufacturing strength.
- Best For: Long-term investment and those using fundamental analysis alongside technical levels.
4. DAX 40 (Germany)
- What it is: The blue-chip stock market index consisting of 40 major German companies on the Frankfurt Stock Exchange.
- Why Trade It: It provides direct exposure to the European market. The DAX has benefited from Germany’s recent manufacturing and energy infrastructure resurgence.
- Best For: Trading during the European market session with tight spreads.
5. FTSE 100 (UK)
- What it is: Tracks the 100 largest companies listed on the London Stock Exchange.
- Why Trade It: Contains heavy representation from global mining, energy, and financial companies, making it highly responsive to global commodities.
- Best For: Traders looking for stable, dividend-heavy, and commodity-driven exposure. A guide evaluating high-yield monthly dividend stocks and REITs for generating consistent income and accelerating compound returns.
6. Nikkei 225 (Japan)
- What it is: The price-weighted index for the Tokyo Stock Exchange.
- Why Trade It: Reached record highs in 2026 due to corporate governance reforms, yen weakness, and strong domestic output.
- Best For: Traders who want exposure to the Asian-Pacific session when the US and European markets are closed.
7. CAC 40 (France)
- What it is: Tracks the 40 most significant values on the Paris Bourse.
- Why Trade It: Offers a diverse mix of multinationals, including leaders in luxury goods, aerospace, and energy sectors. A guide evaluating the top nuclear energy and power stocks fuelled by growing AI data center power demands and hyperscaler deals.
- Best For: European market trading and sector rotation strategies.
8. STOXX Europe 600
- What it is: Represents large, mid, and small capitalization companies across 17 countries of the European region.
- Why Trade It: Offers broad exposure to the European economy rather than relying on a single country.
- Best For: Broad diversification across the European markets.
9. Hang Seng Index (Hong Kong)
- What it is: Measures the performance of the largest and most liquid companies in the Hong Kong stock market.
- Why Trade It: Provides a direct gateway to the Chinese economy and emerging markets in the Asia-Pacific region.
- Best For: Traders who understand emerging markets and geopolitical catalysts.
10. ASX 200 (Australia)
- What it is: Represents the largest 200 companies listed on the Australian Securities Exchange.
- Why Trade It: Heavily weighted toward the financial and materials sectors, giving direct exposure to resource commodities and mining.
- Best For: Traders interested in Australian and Asia-Pacific market dynamics.
Our Forecast Services for Major Indices
At Elliott Wave Forecast, we provide real-time updates, key pivot levels, and technical analysis covering the world’s most important financial markets. Understanding where the market has been and where it is going next allows you to time your positions with precision.
Below is an overview of the specific market indices we track and forecast daily:
Available Index Forecasts
| Forecast Service | Key Focus & Asset Classes | What Our Analysis Includes |
| S&P 500 (SPX) Forecast | SPX / ES_F large-cap index outlook | Short-term and long-term Elliott wave counts, support, and “Blue Box” levels |
| Nasdaq Forecast | NQ_F tech sector and growth indices | AI-sector momentum analysis, cycle transitions, and high-probability reversals |
| Dow Jones Forecast | YM_F blue-chip & industrial cycles | Trend lines, blue-chip divergences, and interest rate reaction levels |
| DAX Index Forecast | DAX, European economic outlook | Intermarket and session-specific wave counts and key breakout areas |
| FTSE Index Forecast | Commodity & international indices | Energy and mining-heavy index analysis and cycle extremes |
| Nifty 50 Forecast | Emerging markets and Asian strength | Broad-based Indian equity tracking and cycle extensions |
| IBEX Index Forecast | Spanish market, regional indices | Sector-specific rotation and cyclical support tracking |
Benefits and Risks of Trading Indices
Trading indices can be a highly lucrative endeavor, but like any financial market, it comes with its own set of rules, advantages, and hazards.
The Benefits of Trading Indices
- Built-in Diversification: By trading an index, you hold a basket of stocks. If one company performs poorly, the impact is cushioned by the other 499 companies (in the case of the S&P 500).
- Clear Technical Patterns: High-liquidity indices like the S&P 500 exhibit clearer technical patterns than individual shares. Moving averages and support-and-resistance zones tend to be respected with higher accuracy.
- Fewer Fundamental Unknowns: Instead of analyzing a single company’s balance sheet, you are analyzing broader economic data—such as interest rates, inflation numbers, and central bank actions.
- Accessibility: With modern trading instruments like index CFDs, futures, and top ETFs, you can trade the entire market on both long and short sides with minimal capital.
The Risks of Trading Indices
- Market-Wide Shocks: If there is a sudden geopolitical crisis or macroeconomic shift, the entire index can fall. You cannot hide behind single-stock performance during a broader market downturn.
- Overnight Financing Costs: If you trade cash indices via CFDs, holding positions overnight incurs financing or swap fees, which can eat into your profits over the long term.
- Leverage Hazard: Indices can be traded with leverage. While leverage magnifies gains, it also accelerates losses if the trade goes against you without proper risk management.
Things to Consider Before Choosing Indices
Before you jump into trading a stock index, consider the following elements to align your trading style with the right instrument:
- Trading Style and Instrument: Are you an active day trader or a swing trader? Index futures are better suited for continuous active trading, whereas index ETFs are better for long-term investments.
- Market Correlation: Understanding how indices track each other is critical. For example, when US markets drop, European and Asian indices usually follow suit due to global risk-off sentiment.
- Broker Fees: Look at the cost of trading. Spreads, commissions, and overnight financing fees can heavily impact your bottom line, especially when scalping.
- Time of Day: Trade during the primary hours of the index’s home country. The S&P 500 experiences its highest volume and lowest spreads during the New York session, while the DAX 40 is most active during the European session.
Why Most Traders Fail at Trading Indices
A significant percentage of retail traders fail when trading indices. The most common reason is a misunderstanding of market trends and market concentration.
For instance, data from early 2026 showed that just a handful of massive technology companies accounted for over 23% of market valuation. This extreme concentration can lead traders to believe the whole market is moving up or down, when in fact, only a handful of stocks are doing the heavy lifting. Other traders fail because they get caught in counter-trend corrections without a clear roadmap.
How Elliott Wave Theory Changes the Game
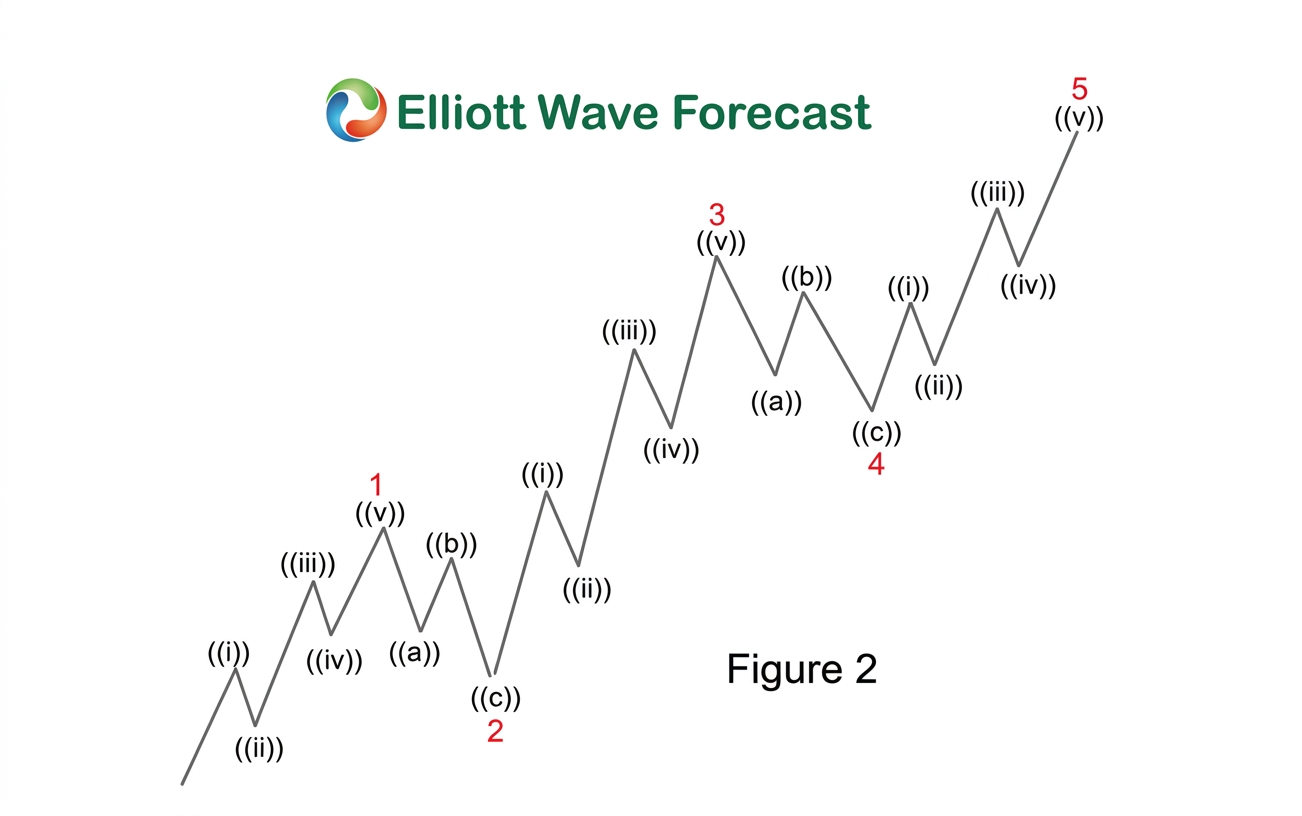
This is where the Elliott Wave Theory comes in. Instead of guessing where the market will go based on sentiment alone, Elliott Wave Theory views market movements as repeating, fractal wave patterns.
Here is how it gives traders an edge:
- Identifying Waves: The market moves in five waves in the direction of the main trend and three waves in the opposite direction. By understanding this structure, you can determine whether a pullback is just a minor correction (like Wave 4) or the start of a larger trend reversal.
 The “Blue Box” System: Our technical framework utilizes a “Blue Box” area, which is a high-probability zone where the market is expected to react. This allows traders to identify entries with a predefined risk-to-reward ratio.
- Removing the Guesswork: When you are aware that a cycle from a specific low is nearing its end, you avoid buying at the top or shorting at the bottom.
Proven Strategies for Trading Indices
To succeed in trading indices in 2026, you need a structured strategy. Here are three methods that professionals use:
Trend Following with Moving Averages
Since major indices tend to trend over the long term, using the 200-day moving average can be an effective way to identify the underlying market trend. If the index is above the 200-day moving average, focus primarily on buying (going long).
News and Event-Driven Trading
Central bank rate decisions and macroeconomic data cause explosive volatility. By monitoring economic releases, traders can capitalize on the momentum that follows major announcements.
Cycle and Fibonacci Extensions
Using Fibonacci retracements and extensions helps determine where a wave will terminate. For instance, after an impulsive wave up from a low, traders can measure where Wave 5 will end, indicating an exit point before a significant pullback begins.
How to Start Trading Indices in 5 Easy Steps
If you are ready to begin, follow this simple checklist to get started:
- Choose Your Broker: Select a regulated broker that offers low spreads and various index-tracking instruments like CFDs, ETFs, or Futures.
- Pick Your Index: Start with the S&P 500 to understand market correlation and liquidity before moving to more volatile instruments.
- Learn Technical Analysis: Master support, resistance, and Elliott Wave counts to understand market cycles.
- Set Your Risk Parameters: Never risk more than 2% of your capital per trade. Use stop-loss orders to protect your account.
- Monitor the News: Stay updated with central bank decisions, employment reports, and global economic data.
Conclusion
Trading stock market indices offers immense opportunities for diversification and growth. Whether you choose the massive technology exposure of the NASDAQ-100 or the steady, balanced growth of the S&P 500, understanding the macro trends, economic drivers, and technical structures is essential.
In 2026, having an analytical framework like Elliott Wave Theory provides the structural advantage you need to navigate the noise of modern, highly concentrated markets.
Ready to take your trading to the next level with our expert analysis? START YOUR SUBSCRIPTION today to get our latest forecasts and real-time market updates!
FAQs
1. Which index is best for beginners to trade?
The S&P 500 is generally considered the best index for beginners. It is less volatile than the NASDAQ-100 and has broad exposure to the broader US economy, with reliable technical patterns.
2. Can I trade indices with a small amount of capital?
Yes. Many brokers offer CFDs (Contracts for Difference) or micro-futures, allowing traders to trade fractional amounts of index value with lower capital requirements.
3. How does the AI boom affect the S&P 500 and NASDAQ in 2026?
Technology and AI-related spending make up a large portion of earnings growth in 2026. Because of this, indices heavily weighted toward tech companies tend to be more sensitive to AI sector developments.
4. What is the best time of day to trade the S&P 500?
The most liquid and active time to trade the S&P 500 is during the New York trading session (9:30 AM to 4:00 PM EST), when the underlying stocks are open for trading.


