
Published on
Who can benefit from our services?

Retail Traders & Investors
Join us never trade alone-we help traders like you become more profitable with our proven market forecasts & signals.

Experienced Traders Seeking Validation
Have you ever second-guessed your trades? Our expert forecasts allow you to validate and confirm your own analysis.

Professionals Seeking Elliot Wave Mastery
Master Elliot Wave analysis like a pro and gain the advanced strategies needed fir successful trading.
Chart of the Day | July 31, 2026
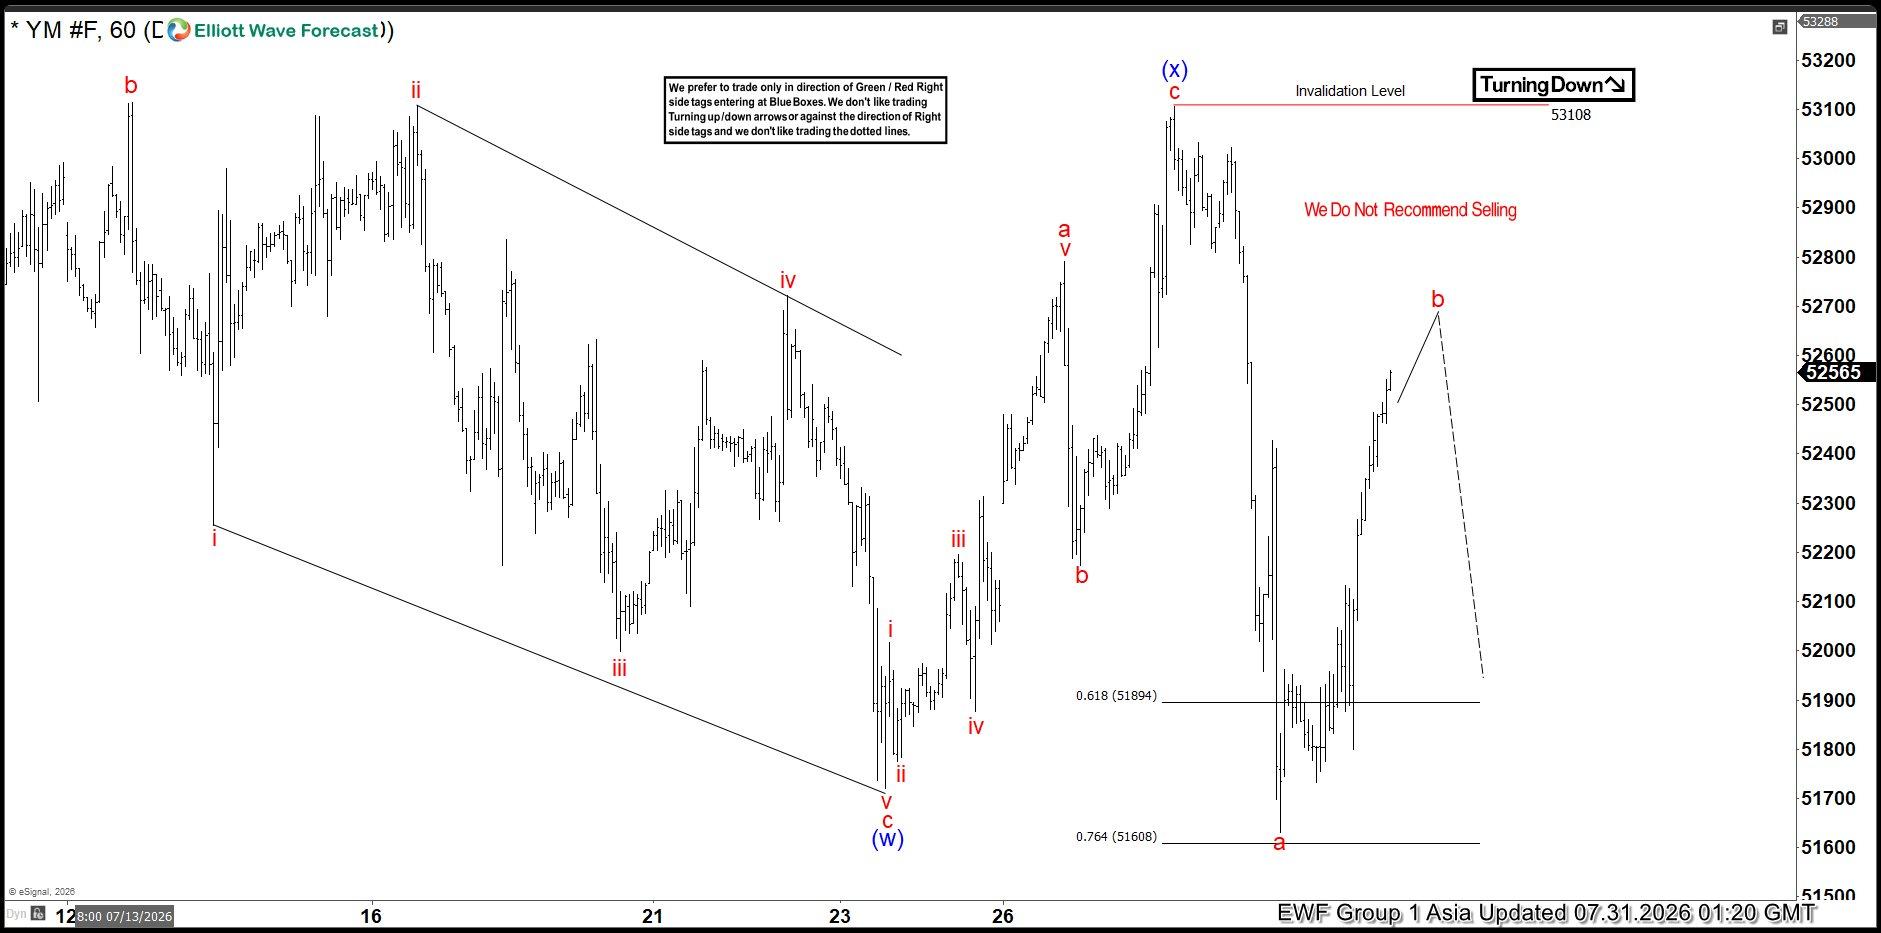
Dow Jones Futures Wave 2 Pullback Targets 51,182–49,991
Subscribe to receive FREE Market Analysis
Don't miss out on daily video analysis, educational content, market reactions from blue boxes & subscriber only discounts.
Featured Articles, News & Analysis
RDDT Is About to Surprise Everyone — Here’s Why
RDDT Is About to Surprise Everyone — Here’s Why
Reddit (RDDT) has spent the past year proving something the market wasn't fully pricing in a year ago: this isn't…
Beyond the Hype: Why Vertiv (VRT) is Mapping Out the Cleanest Elliott Wave Structure of the Quarter
Beyond the Hype: Why Vertiv (VRT) is Mapping Out the Cleanest Elliott Wave Structure of the Quarter
When retail traders look for ways to play the ongoing artificial intelligence supercycle, they almost universally flock to the same…
Dow Jones Futures ($YM_F) Elliott Wave: Trading Setup Explained
Dow Jones Futures ($YM_F) Elliott Wave: Trading Setup Explained
Hello traders. In this technical article we’re going to take a quick look at the Elliott Wave charts of Dow…
Crude Oil (CL_F): High-Probability Sell Setup at the Blue Box Area
Crude Oil (CL_F): High-Probability Sell Setup at the Blue Box Area
Hello fellow traders. In this technical article we’re going to take a quick look at the Elliott Wave charts of…
