Hello fellow traders. In this technical article, we take a quick look at the Elliott Wave charts of IWM iShares Russell 2000 ETF published in members area of the website. The ETF has recently given us Double Three pull back and found buyers again precisely at the equal legs area as we expected. In the following text, we’ll explain the Elliott Wave count.
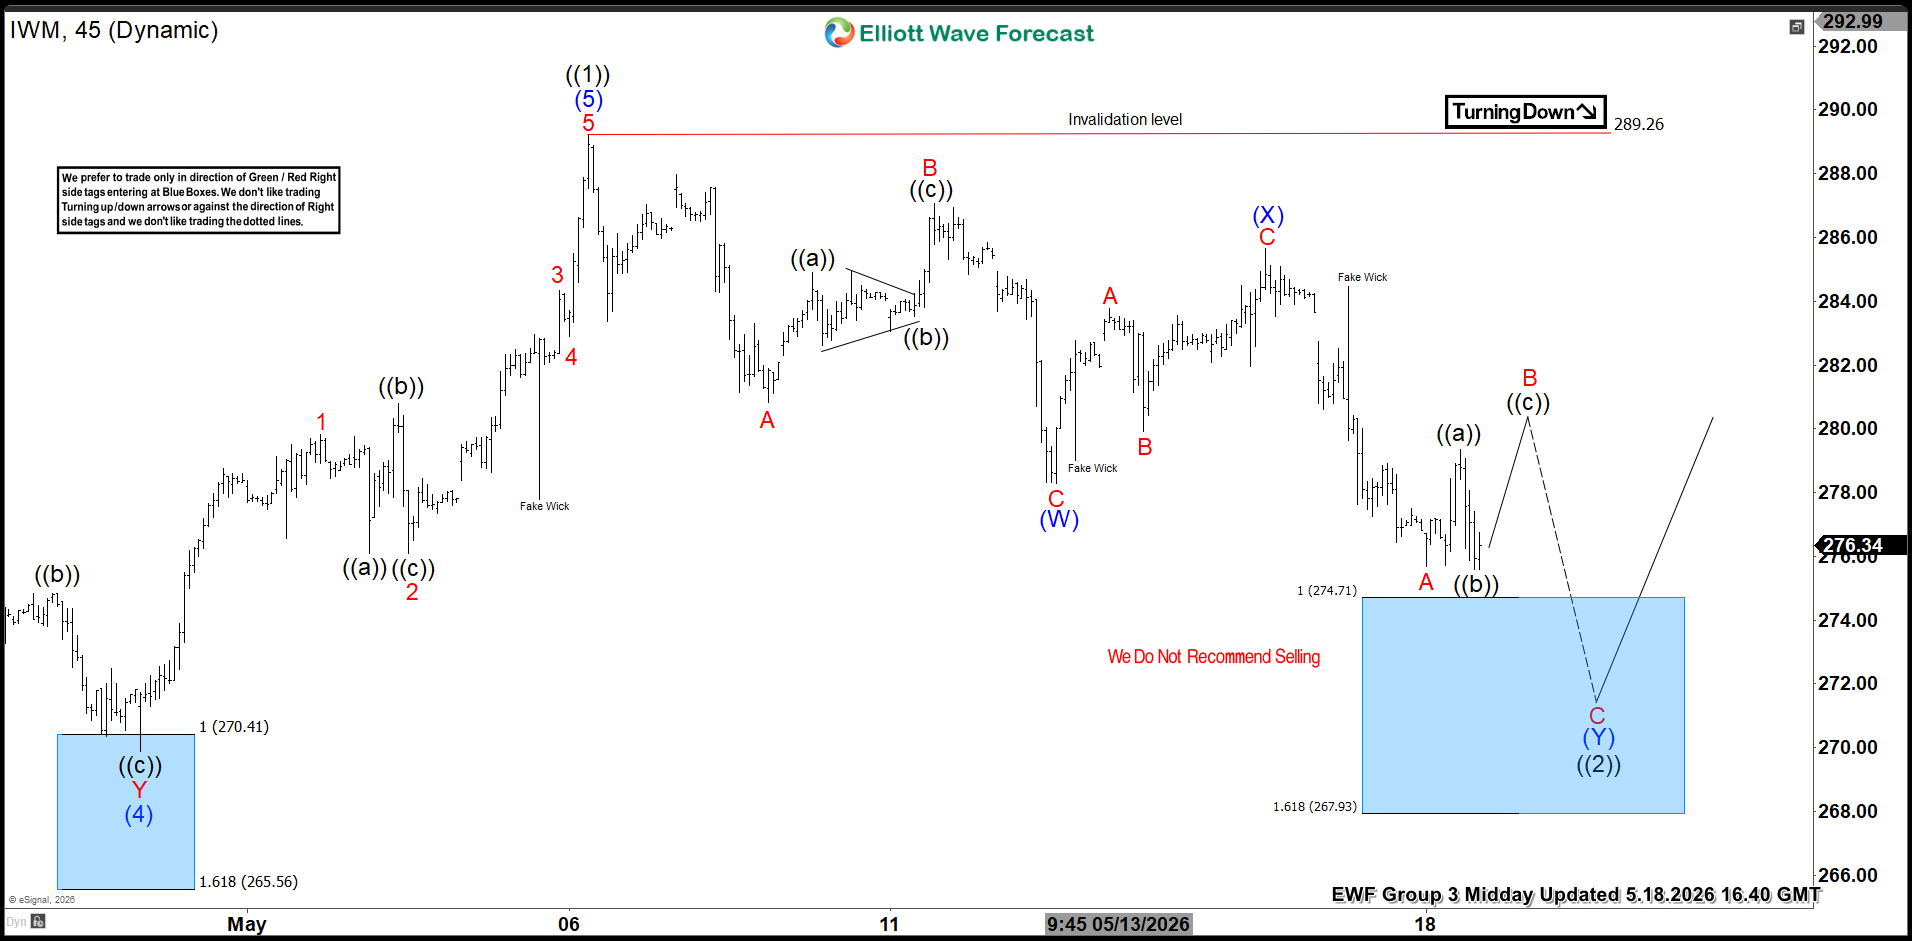
IWM Elliott Wave 1 Hour Chart 05.18.2026
The ETF is forming a 3-wave pullback, unfolding as a Double Three pattern. At the moment, we can see incomplete sequences. Our members know that we constantly emphasize the importance of incomplete sequences, as these determine the market’s path.
The structure suggests more weakness toward the Equal Legs area at 274.71-267.93, buying zone. We expect at least a three-wave bounce from the Blue Box area. Once the price reaches the 50% Fibonacci retracement against the (X) connector, we will make the position risk-free by moving the stop loss to breakeven and booking partial profits.
Official trading strategy on How to trade 3, 7, or 11 swing and equal leg is explained in details in Educational Video, available for members viewing inside the membership area.
90% of traders fail because they don’t understand market patterns. Are you in the top 10%? Test yourself with this advanced Elliott Wave Test
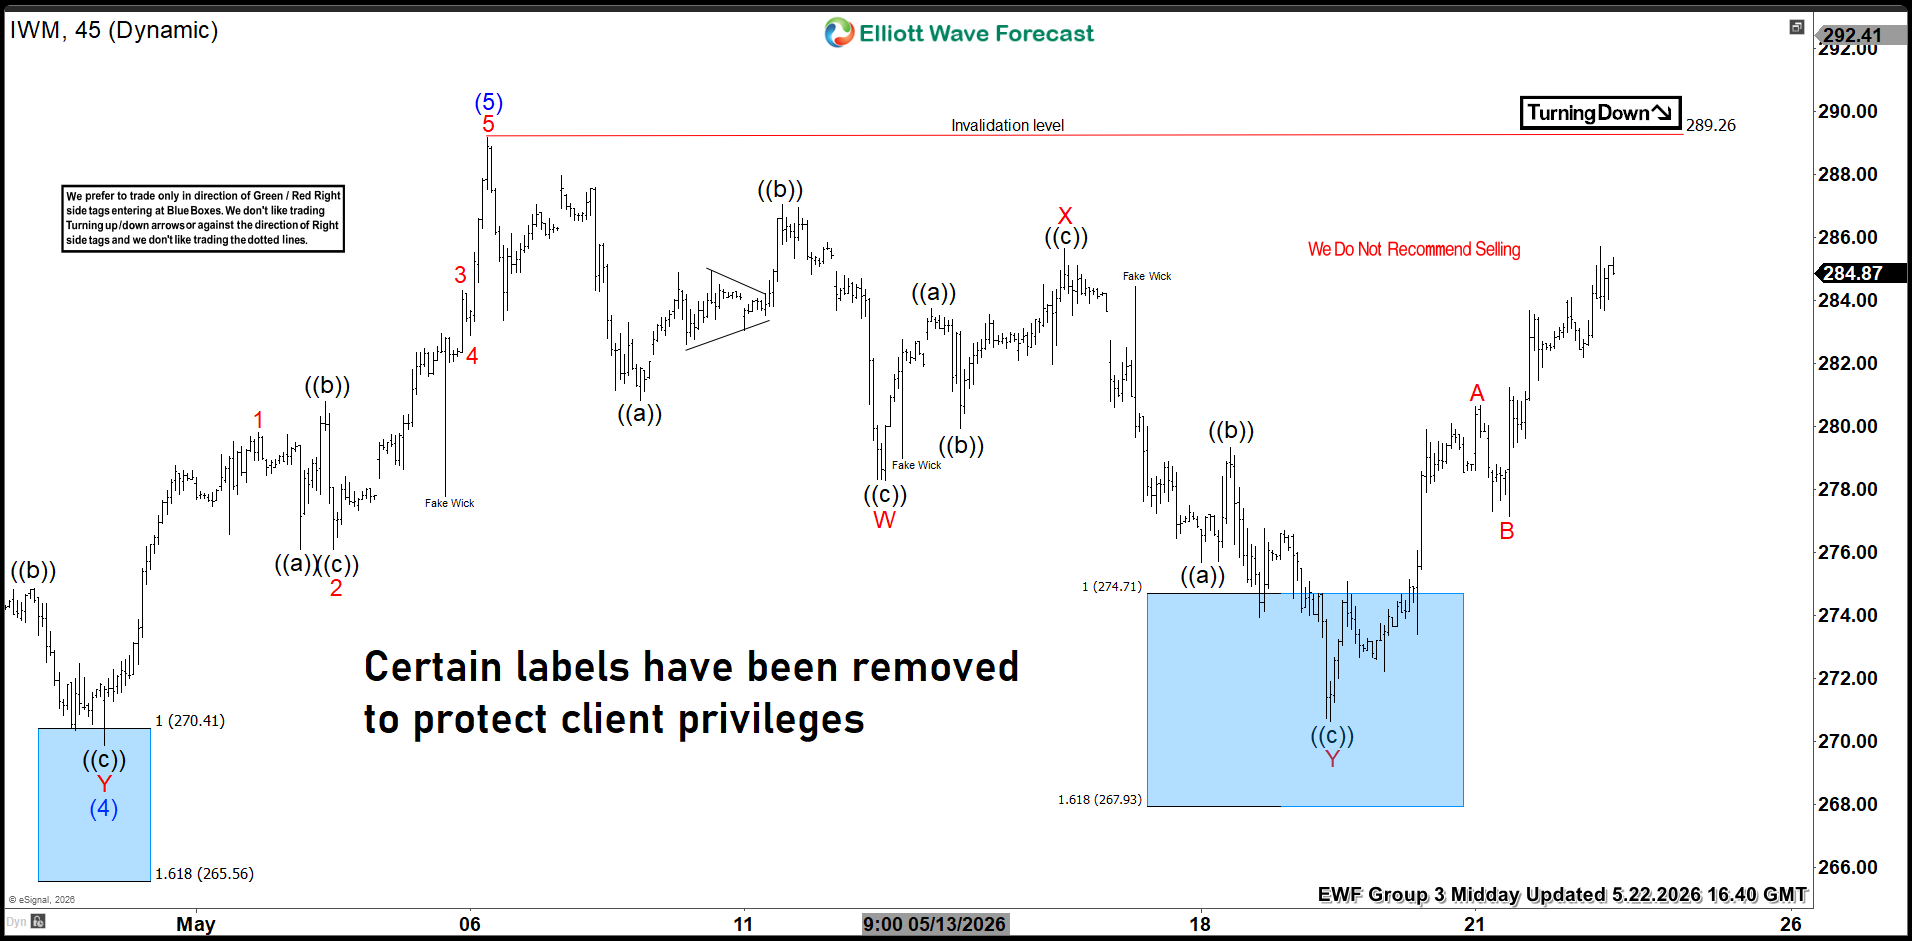
IWM Elliott Wave 1 Hour Chart 05.22.2026
IWM made proposed leg down and found buyers as expected at the Blue Box area, making decent bounce. Any longs from the blue box zone should be risk free. 289.26 is the key level at this stage. A break above this peak would confirm a bullish continuation for the ETF and open the door for further upside extensions
Reminder for members: Our chat rooms in the membership area are available 24 hours a day, providing expert insights on market trends and Elliott Wave analysis. Don’t hesitate to reach out with any questions about the market, Elliott Wave patterns, or technical analysis. We’re here to help.
Thank you for exploring our IWM technical article with us. While we analyze 78 instruments, it’s important to remember that not every chart represents a trading recommendation. For official trading signals, we invite you to join our Live Trading Room, where we provide actionable insights in real-time. If you’re not yet a member, take advantage of our 14-day trial to unlock new trading opportunities.
Over the years, we’ve developed a reliable trading strategy that clearly defines entry, stop loss, and take profit levels. By joining us, you’ll gain access to expert guidance and the chance to refine your trading skills
Join us today !
 Elevate your trading with Elliott Wave Forecast!
 Ask unlimited questions during trading hours (Monday to Friday). Our Chat Rooms are an excellent place to learn, with continuous support from our market experts!
 Explore our expert insights and real-time analysis covering Forex, Indices, Commodities, Cryptocurrencies, Stocks, and ETFs across 78 instruments.
 Gain exclusive access to our Official Trading Recommendations in the Live Trading Room, where seasoned experts provide valuable insights and guidance on new trading opportunities.
 For just $0.99, unlock a wealth of knowledge and experience with our 14-day Trial. Experience firsthand our proven trading strategy, which accurately defines Entry, Stop Loss, and Take Profit levels, empowering you to make informed decisions with confidence.
 Ready to take the next step? Get your 14-day Trial in just a few clicks!
Offer Expires Soon!
Get full access to real-time Signals, Live Sessions, 24 Hour Chat Room Support and Expert Analysis — all for only $0.99 during your 14-day trial.
⏳ This limited-time price will expire soon — don’t miss out!


