

ASML Holding N.V., (ASML) provides lithography solutions for the development, production, marketing, sales, upgrading & servicing semiconductor equipment systems. It also offers hardware, software & services to chipmakers to produce the patterns of integrated circuits. It comes under Technology sector & trades as ‘ASML’ ticker at Nasdaq.
ASML is bullish in weekly, favors rally in I of (III) of ((III)) in nest structure. It favors rally in ((5)) towards $2108 – $2287 area against 7.29.2026 low to extend April-2025 rally. We like to buy the pullback in 3, 7 or 11 swings at extreme area.
ASML – Elliott Wave Latest Daily View: 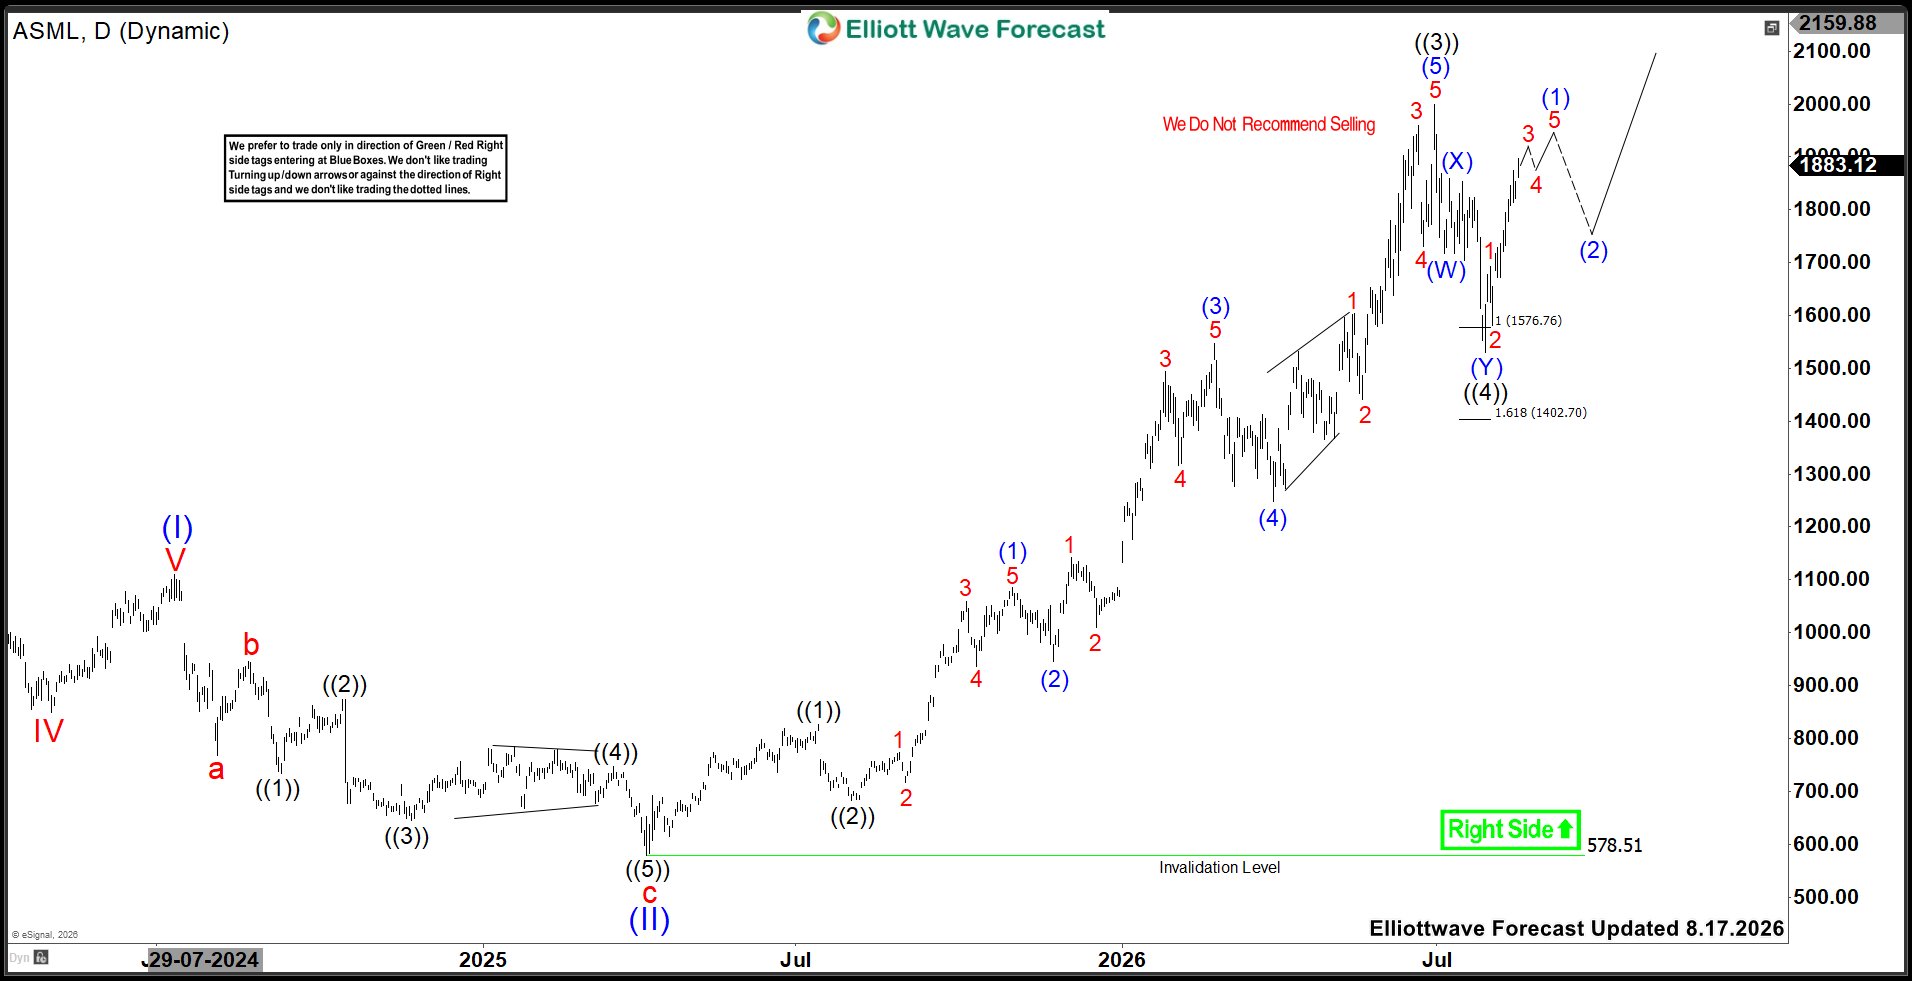
In weekly, it ended ((I)) at $895.93 high (September-2021) & ((II)) at $363.15 low (October-2022). Above there, it ended (I) of ((III)) at $1110.09 high (July-2024), (II) at $578.51 low (April-2025) & favors rally in (III). Within (I), it placed I at $771.98 high, II at $564 low, III at $1056.34 high, IV at $849.14 low & V at $1110.09 high. Below there, it ended a of (II) at $767.41 low, b at $945.05 high & c at $578.51 low. Above April-2025 low, it ended ((1)) of I at $826.56 high, ((2)) at $683.48 low, extended ((3)) at $1999.96 high, ((4)) at $1530.64 low & favors upside in ((5)).
ASML – Elliott Wave Latest Weekly View: 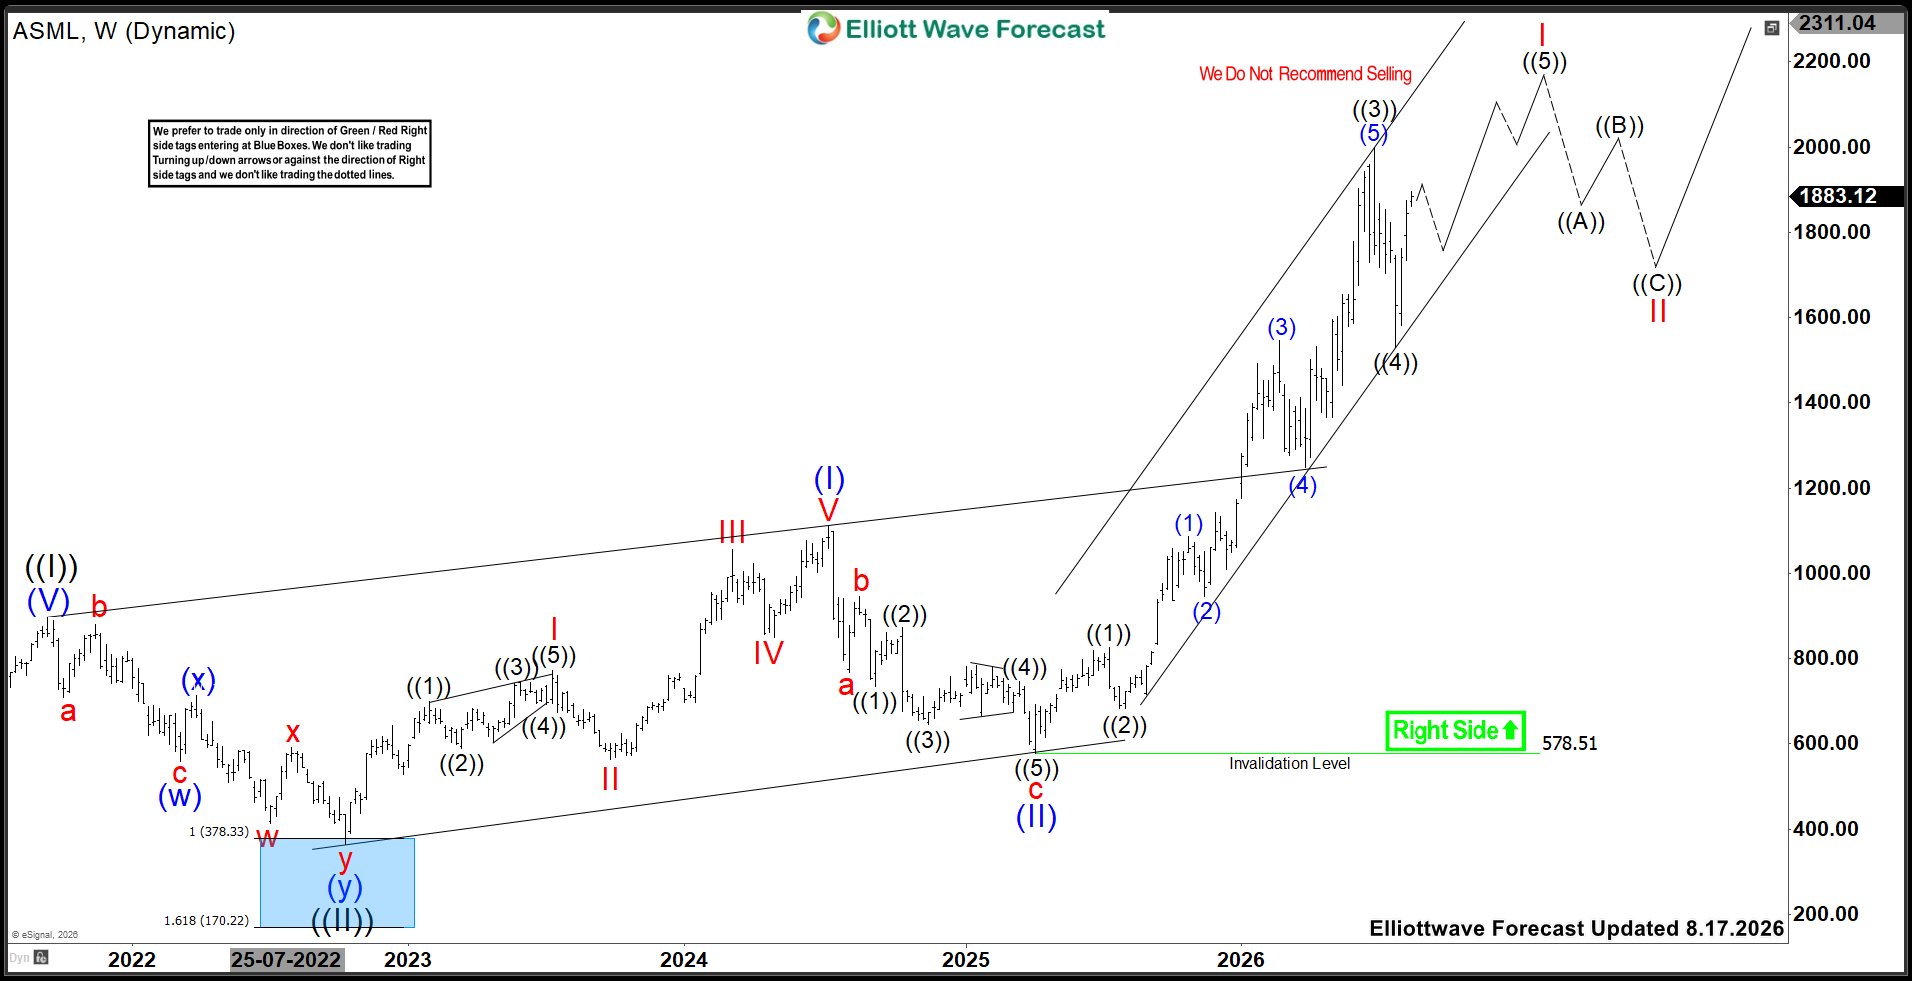
Within ((3)), it ended (1) at $1086.11 high, (2) at $946.11 low, (3) at $1547.22 high, (4) at $1248.11 low & (5) at $1999.96 high. The ((4)) unfolded in double correction & found support in extremes between $1576.76 – $1402.70 area. Currently, it favors rally in (1) of ((5)) & expect small upside against 7.29.2026 low before correcting it. Buyers from ((4)) extremes can be risk free & looking for rally into $2108 – $2287 area to finish I of (III). Above $2287, it can extend up to $2538.2 to finish rally. Further upside will confirm above June peak. Alternatively, if it breaks below 7.29.2026 low, it can be II pullback, while proposed ended I at June-2026 peak.
The ASML is not the part of regular service. Elliottwave Forecast updates 1-hour charts four times a day & 4-hour charts once a day for all our 78 instruments. We do a daily live session, where we guide our clients on the right side of the market. In addition, we have a chat room where our moderators will help you with any questions you have about what is happening in the market at the moment. You can try us for 14 days. Also, you can check out the Educational section to learn Elliott wave theory & its application through different packages available & 1-1 coaching for doubts.


