Leonardo Pisano, widely known as the Fibonacci or Fib Man, was a great mathematician of his time. As a young man, Fibonacci was always fond of numbers and studied mathematics extensively. In 1202, Fibonacci came up with a weird number sequence that was derived from Hindu-Arabic numeral systems. Later, the sequence was referred to as the Fibonacci sequence and was comprehensively used by many top traders, hedge fund managers, and investors in their respective trading styles and strategies. In the sequence, after 0 and 1, every number is the sum of the two prior numbers such as 0,1,1,2,3,5,8,13,21,34,55,89, etc. The golden ratio in these sequences is 1.618, as every number is over 1.618 times higher than the preceding number. According to Fibonacci, the golden ratio is 1.618, as it frequently appears in different scenarios in the natural world. For example, the 1.618 number frequently appears in Fine arts, biology, and architecture subjects. According to different scientists, the golden ratio value has been repeatedly found in nature, such as in flowers, human faces, tree branches, and even galaxies.
The sequence numbers derived by Leonardo Pisano are extensively used in different trading styles. Some of these trading strategies use the Fibonacci sequence numbers for understanding possible areas of retracement and extension of the prices in the future. Sounds too scientific? Don’t worry. This article will elucidate Fibonacci trading strategies such as Fibonacci Retracement and Fibonacci Extensions.
What Are Fibonacci Retracement Levels?
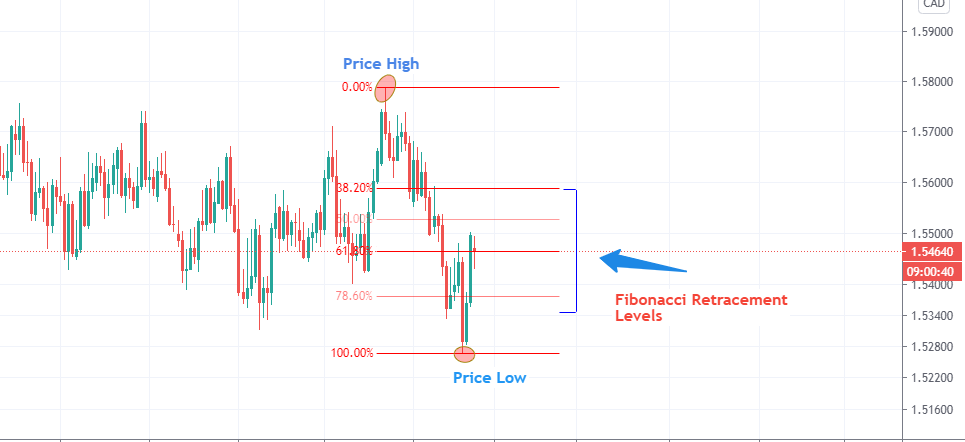
In general, Fibonacci retracement levels are some horizontal lines that indicate where a possible retracement of a price may occur. The Fibonacci retracement levels elucidate some key areas of support and resistance to the traders/investors. The Fibonacci retracement levels are associated with a single percentage point. These percentage points signify how much of a previous price impulse the price has currently retraced to. These Fibonacci numbers include 23.6%, 38.2%, 50%, 61.8%, and 78.6%.
The Fibonacci indicator that is provided on most of the trading platforms can be handy as it indicates potential retracement levels of stock, pair, or a commodities’ price. The Fibonacci indicator can be drawn in different ways, such as it can be illustrated by connecting two significant price points where significant impulse has occurred. For example, it can be drawn by dragging from a recent price high on a chart to a current price low. In this way, you will be able to gasp potential retracements of that significant price impulse. Sounds hectic? Check out the illustration below:

Image Credits: TradingView
Related Reading :
Fibonacci Retracement Levels as Trading Strategy
Fibonacci retracements are mostly used in alignment with different trend continuation and trend-trading strategies. In its essence, the traders use Fibonacci retracement strategies by identifying a golden Fibonacci number or a strong Fibonacci level, where the previous trend might continue for a new low (in a bear trend) and a new high (in a bull trend).
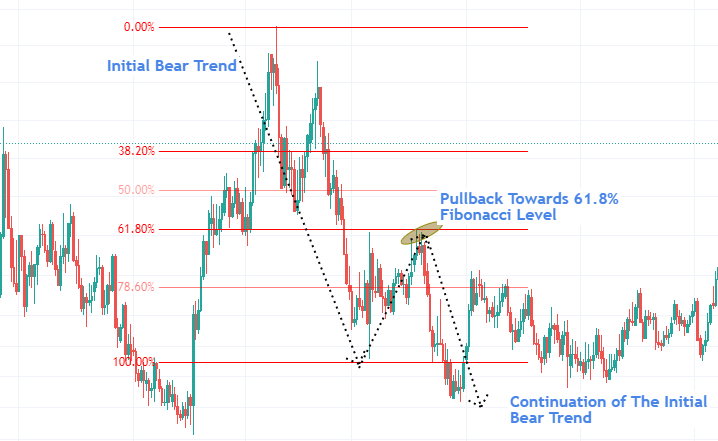
For example, on the H4 chart drawn below, we can see an initial bear trend. After which, the market retraced towards the 61.8% golden Fibonacci level – where the price reversed and created a new low.

Image Credits: TradingView
Moreover, the reversal from the retracement levels increases if more technical confluences align with that certain retracement level. The 61.8% retracement level is backed up with a robust resistance key level in the scenario illustrated above. For this reason, the reversal occurred frequently and smoothly. Additionally, other confluences such as trendlines, moving averages, exponential moving averages, volume, price oscillators, candlestick patterns, and price patterns can also be helpful in providing more strong reversal from the retracement levels.
Also read: Best Stock Forecasts & Prediction Services
What Do Fibonacci Retracement Levels Tell You?
Fibonacci retracement levels can be used in a wide variety of trading strategies. Many traders and investors use Fibonacci retracement levels for finding potential entry orders or even stop-loss levels. Most of the trader’s belief is that a support/resistance level backed up with a Fibonacci retracement level has a higher probability of working. One of the leading trading strategies used with Fibonacci retracement levels is the trend continuation strategy. For example, if a trader notices a big impulse to the downside. The trader decides to drag his Fibonacci tool from the high point of the impulse to the low point. After this, he notices a pullback in price to the golden ratio number of 61.8%, and he decides to sell the stock/commodity there. As the price previously went down significantly, there was a high probability that the price would further move to the downside. In this scenario, the Fibonacci retracement levels helped the trader decide where his entry order should be for the possible trend continuation trade.
Many traders use Fibonacci retracement levels in alignment with other great strategies and patterns. For example, many traders and investors use Fibonacci retracement for entry orders when trading a Gartley pattern or using the Elliott wave theory.
In general, Fibonacci retracement levels are also static prices that are not dynamic, unlike moving averages (MAS) and exponential moving averages (EMAS). For this reason, they are easy to find and are highly precise with price points.
Also read: Best Gold Trading Signals.
Limitations of Using Fibonacci Retracement Levels
As trading is highly uncertain, the technical analysis and technical indicators can be entirely useless when fundamentals of the market or market sentiment come into play. For example, if Fibonacci retracement level 61.8% indicates that the price might reverse from there. It does not actually mean that the price may reverse from there all the time. For this reason, in order to defy this limitation, the traders must use other confluences such as support/resistance and moving averages. Also, the traders can navigate through the fundamentals and understand if certain stock or commodity fundamentals and news are in alignment with their trade setups or not.
Another limitation in Fibonacci retracement level strategies creates a dilemma in many traders. For example, as the retracement levels are close to each other, many traders fall into an extensive dilemma when they think a certain retracement level would work and another would not. For this reason, it is crucial to understand and discover that which retracement level works for you and stick to that level by eliminating other retracement levels.
Get to know the best covered call stocks to buy now.
Fibonacci Retracement Levels Summary
- Fibonacci Retracement Levels are used in strategies for connecting two distant or close points of price in order to grasp the potential retracements of the price. Typically, the retracement levels are used by dragging the Fibonacci tool from a high point to a low point.
- The percentage levels of Fibonacci retracements are nothing but some price levels where a stock’s price may reverse or stall upon
- Main Fibonacci numbers are 61.8% and 38.2%. These numbers are considered as most used numbers where institutions, hedge funds, and banks have large orders waiting to be triggered.
- As you are a trader, you should not rely solely upon these numbers for your trading decisions. You must also include other confluence to your trading strategy, which may also include support and resistance levels. A strategy with Fibonacci numbers and critical support and resistance areas can have a higher probability of providing consistent trading income.
Read more:
What are Fibonacci Extensions?
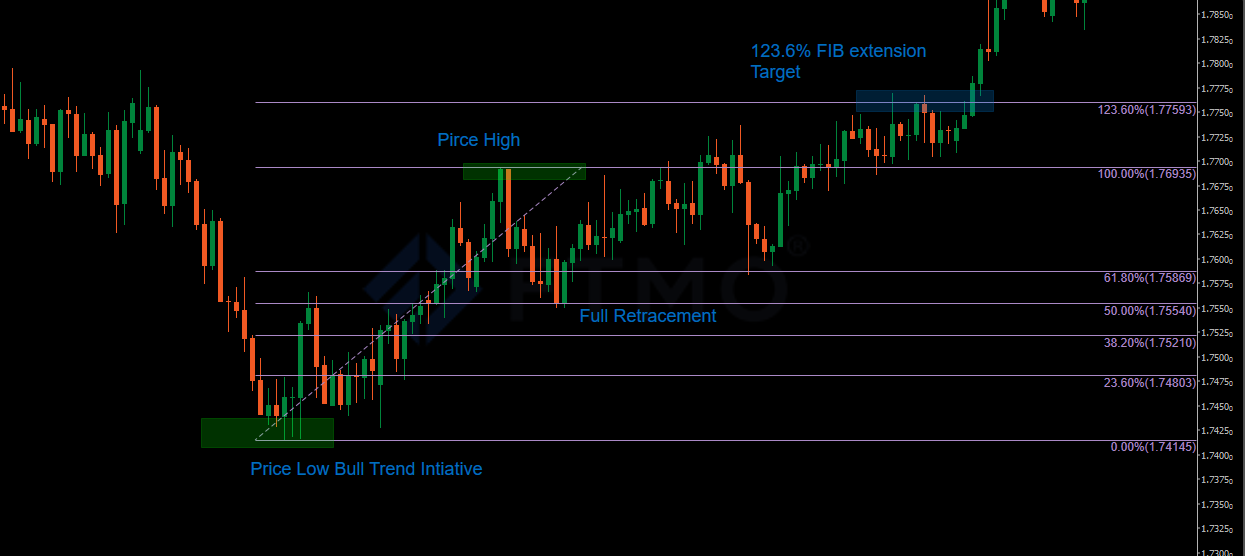
In general, Fibonacci Extensions are the levels used by traders to identify potential profit targets and estimate a continuation of a price move after a pullback or reversal. Fibonacci extension levels are highly useful in understanding reversals and possible obstructions in price continuations. Put simply, Fibonacci extension levels are the key areas where the price of a particular stock, forex pair, or commodity might reverse from.
Extensions can be laid out by simply using the Fibonacci Retracement Tool, and the indicator automatically draws out different extension levels where prices can be reversed from.

Image Credits: CTrader
What Do Fibonacci Extensions Tell You?
Fibonacci extensions can be highly utilized in different trading strategies and trading styles. These extensions can validate critical support and resistance areas, find potential reversal points and trend reversal areas. For this reason, traders utilize this tool to project their overall bias on a bear/bull trend.
Sometimes, it can be highly arduous in a consolidating market to find a key support/resistance area. In such a scenario, Fibonacci extensions can help traders find those key support/resistance areas. A mix of Fibonacci extension tools and a consistent support/resistance strategy can help traders elevate their trading consistency.
As good as it sounds, it is crucial to notice that the price can break Fibonacci extension levels and do not act upon it. Also, it is imperative to know that the Fibonacci extension levels elucidate possible areas of interest. These levels do not signify that the price must reverse from the extensions, but it only represents a level’s importance. For this reason, it is important not to trade solely based upon Fibonacci extensions. A mix of another trading strategy and the use of the Fibonacci extension as a confluence to an already-working trading strategy can be instrumental. For example, the price can easily break the 123.60% extension percentage and may reverse from 161.80%.
Moreover, suppose a trader is taking advantage of a bull trend in stock and has long positions set on the stock. In that case, the trader can easily layout Fibonacci extensions and look for possible literate take profit levels. The Fibonacci extension can help the trader identify different reversal points.
Fibonacci extensions can be utilized on any timeframe and any financial market chart. There are no limits to it. As Fibonacci extensions can be used on all the timeframes, a convergence of different extensions on different timeframes on the same key level can make that Fibonacci extension a very crucial and important area.
Read: Best stock signals and providers.
Using Fibonacci Extensions
While Fibonacci retracement provides traders with vital functional areas where a pullback might reach, the Fibonacci extension can help traders attain literate profit targets for their trend continuation entry orders. The Fibonacci extension levels consist of the groups residing beyond the 100% Fibonacci numeral system. The primary and frequently working Fibonacci extension levels include 161.8%, 261.8%, and 423.6%.
Fibonacci Extensions Summary
- The most used Fibonacci extension levels are 123.60%, 161.8%, 200%, and 261.8%.
- The Fibonacci extension tool lays out different areas where the price can potentially move following a Fibonacci retracement pullback.
- Fibonacci extension levels can be useful in laying out possible areas of interest and significance for traders.
- Fibonacci extension levels are used in alignment with other strategies; it elucidates the traders, potential reversals, and takes profit levels.
- Fibonacci extensions can be highly utilized in different trading strategies; however, it is not recommended to rely upon Fibonacci extensions solely.
- Fibonacci extensions are also used to validate some critical support and resistance areas/levels.
Difference Between Fibonacci Retracement and Fibonacci Extension
| Fibonacci Retracement | Fibonacci Extension |
| Indicates how deep a retracement should be | Indicates where the price will go following a retracement |
| Measures Pullbacks Within a Trend | Measures the trend impulses waves in the direction of the trend |
| Provides good entry orders and stop-loss level in a trend-trading strategy | Provides good reversal points in trend reversal strategies and good take-profit points |
| It can be extensively used as a profitable strategy with other confluences | It can be used in a taking profit strategy and may also show good trend reversal points |
| Fibonacci Numbers are within the initial trend. (38.2%, 61.8%, 50%, etc.) | Fibonacci Numbers are beyond the 100% Fibonacci level. (1.618%, 123.60%, etc.) |
Fibonacci Retracement and Fibonacci Extensions related to Elliott Wave
Suppose you are a new trader trying to learn how to use Elliot Wave Analysis effectively. In that case, you must understand the core relationship between Fibonacci ratios and Elliot Wave Analysis. Many sophisticated traders combine Elliot Wave analysis with Fibonacci Ratios in order to conduct a smooth and high confluence technical analysis.
Using Fibonacci Extension 123.6% in Elliot Waves
One of the most used Fibonacci key levels in the Elliot wave analysis is 123.6%. The 123.6% Fibonacci level enables traders to formulate their mind for potential reversal points of the first wave. For example, suppose a trader draws a 123.6% extension of the First wave while conducting Elliot wave analysis. In that case, the trader can benefit from potential target levels if he/she is trading the first wave. The 123.6% Fibonacci extension is also used to curate a flat Elliot Wave correction.
Use of Fibonacci Retracements in Elliot Wave Analysis
Typically, Fibonacci retracements in Elliot wave analysis, Wave 2 resides at 50%, 61.8%, 76.4%, or 85.4% of wave 1. This can be highly beneficial for novice traders, as it can help evaluate perfect target points and entry levels.
Some Other Fibonacci Extensions and Fibonacci Retracements in Elliot Wave Analysis
- Wave 3 is typically 161.8%, 261.8%, or 323.6% of wave 1
- Wave 4 is typically 14.6%, 23.6%, or 38.2% of wave 3
- Wave 5 is typically inverse 1.236 – 1.618% of wave 4, equal to wave 1 or 61.8% of wave 1+3
Master Elliott Wave and Elliott Wave Theory like a Pro. Download Free E-book.
Disclaimer: None of the information published in this article should be construed as investment advice. Article is based on author’s independent research, we strongly advise our readers to always do their due diligence before investing.
You may also like reading:
- Best Crypto Currencies To Invest
- Best Penny Stocks to Invest
- Best Renewable Energy Stocks to Invest
- Monthly Dividend Stocks to Buy


