

One of the ways to determinate end of corrections(potential reversal areas) is by using Fibonacci retracement levels in your analysis approach . In this blog, we’re going to explain some basic things about Fibonacci retracements.
Fibonacci retracement is a popular tool among Elliott Wave practitioners and is based on the key founded by mathematician Leonardo Fibonacci. The most important Fibonacci ratios are 23.6%, 38.2%, 50%, 61.8%, 76.4% and 100%.
Determination of right retracement area is based on several things like previous wave structure and market correlation.
In most cases regular corrections end at 50%-61.8% Fibonacci retracement area. Examples: Wave 2 of 5 wave structure, Wave X of double/ triple three, Wave B of Zig Zag.
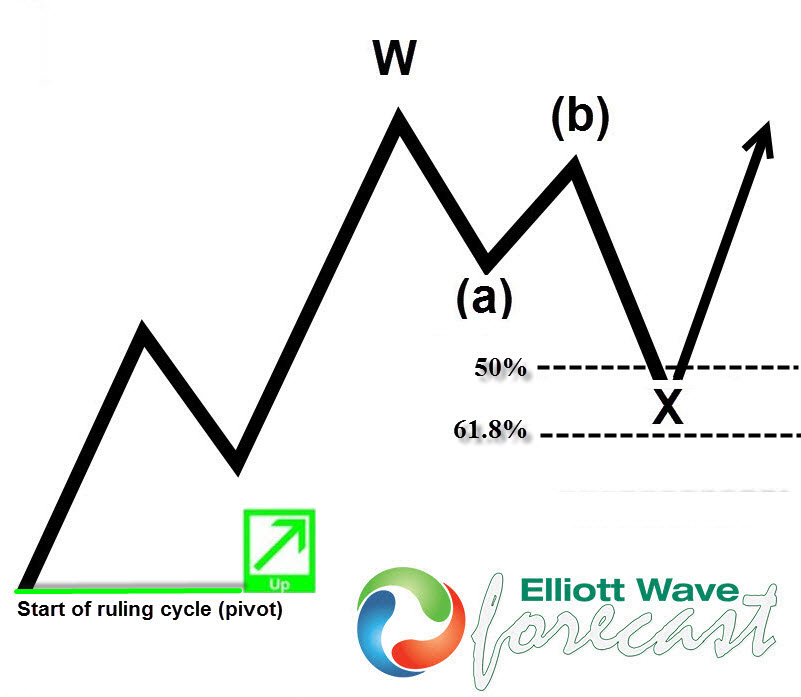
Strong trending market ends corrections as shallow pullbacks/ recoveries at 23.6%-38.2% area. The best example is wave 4.
Deep corrections could be found in triangle structures (76.4%) and Flat patterns (90%,100%)
There are a lot of examples when correction ends at 50-61.8 fib area,let’s take a look at some of them
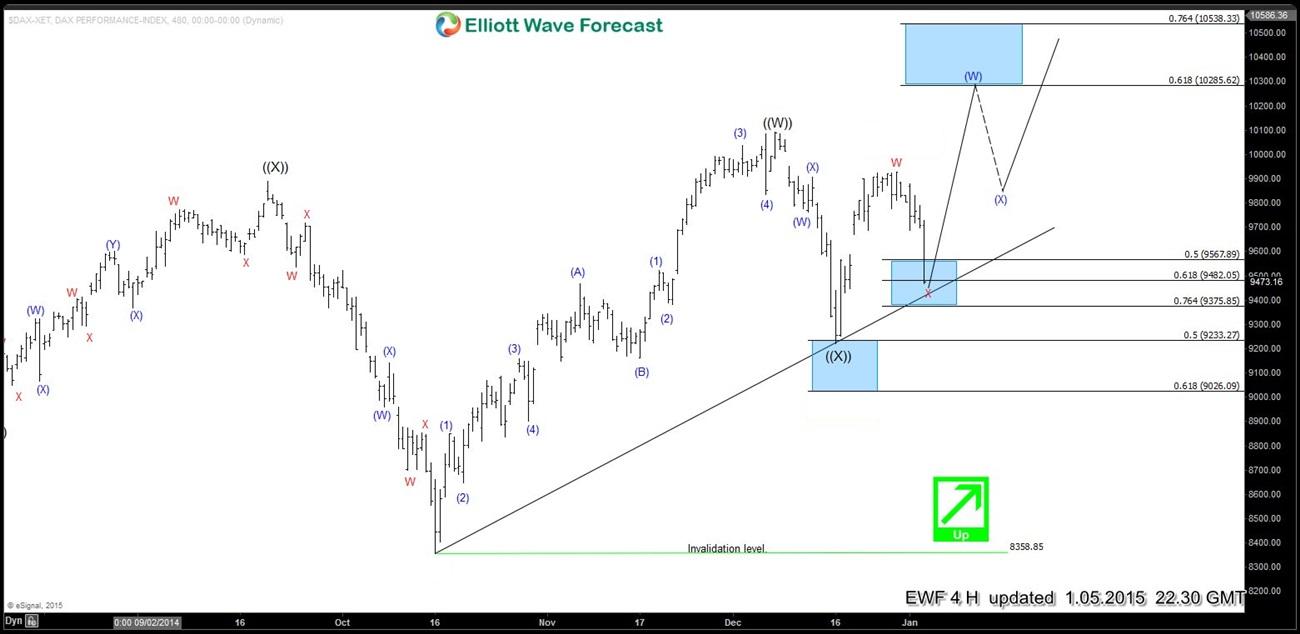
$DAX 1.5.2015. Index is correcting the cycle from ((X)) low, it’s currently at 61.8 fib level. We are expecting the trend line and ((X)) low to hold and favour the longs from this area
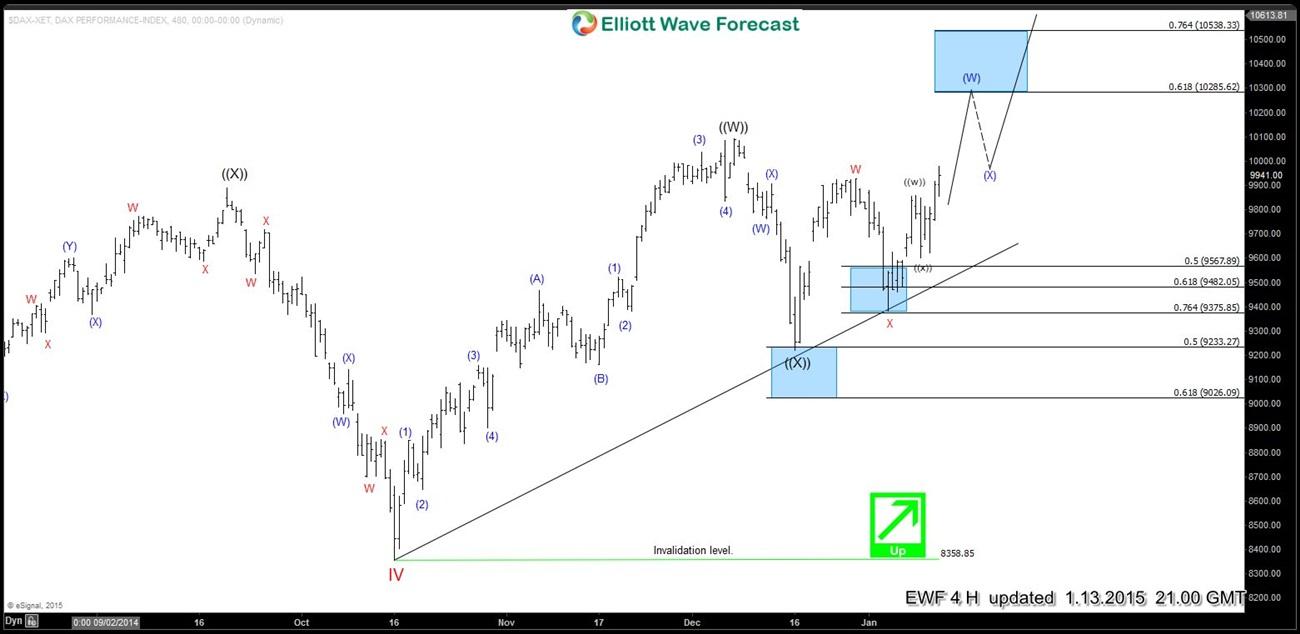
$DAX 1.13.2015. Index dropped further to 76.4 fib level (lower end of the box) and has resumed the rally as expected.
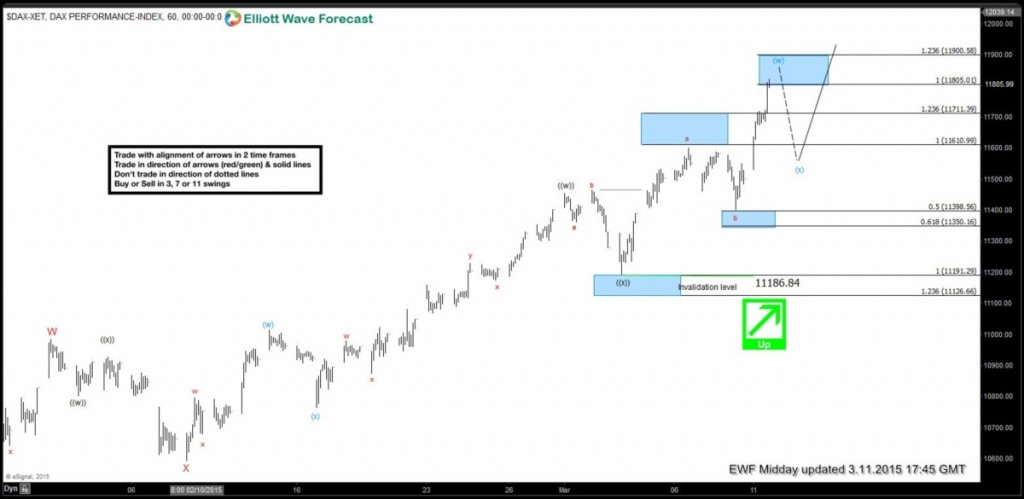
$DAX 3.10.2015. The index is correcting cycle from 1186.84 low in wave X pull back which is expected to end at 50-61.8 fib retracement zone (potential buy )
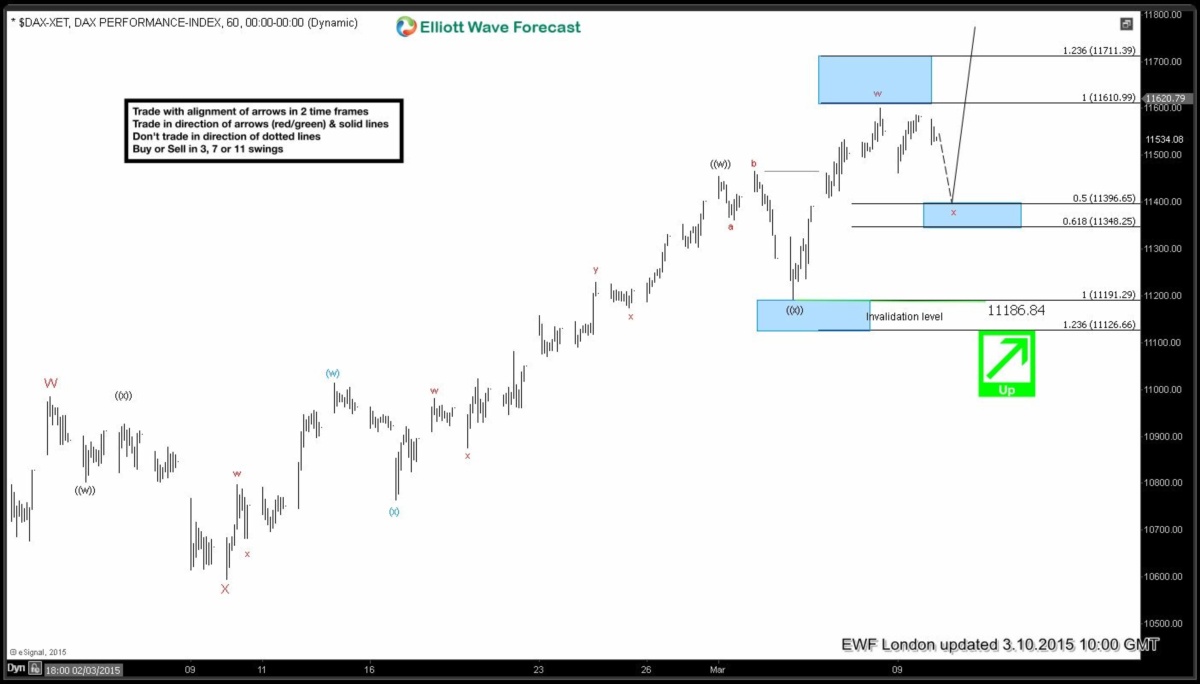
$DAX 3.11.215. The Index has reached 50 fibs and turned higher as expected.
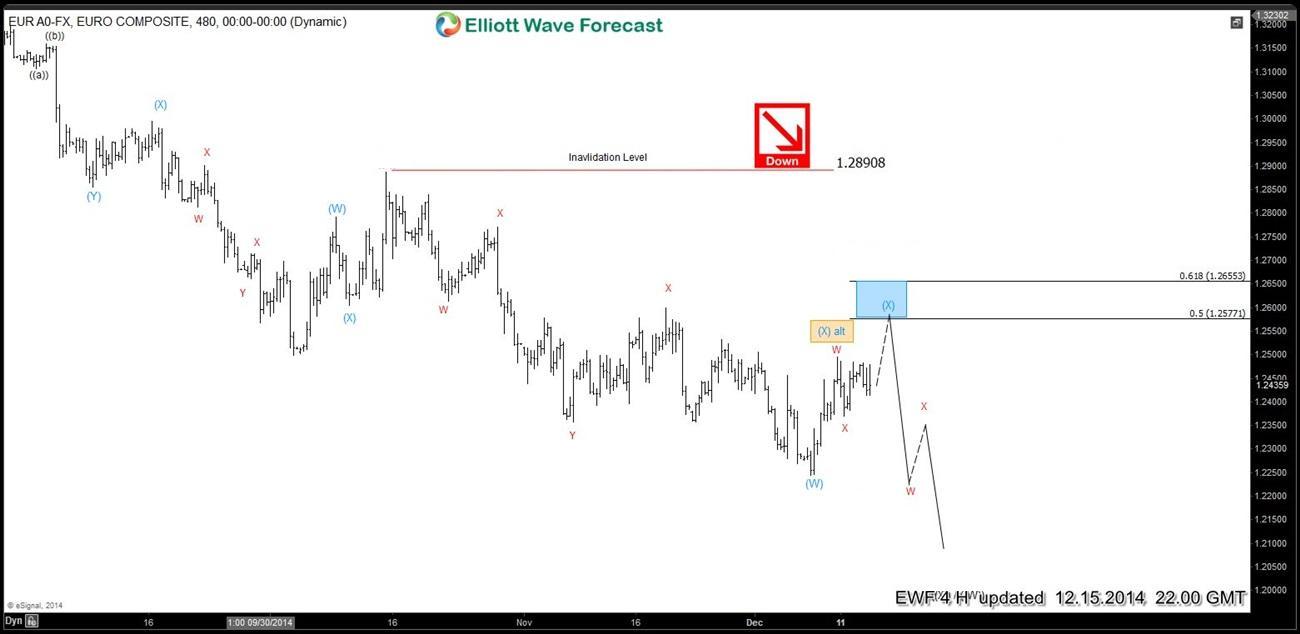
$EURUSD 12.15.2014. The price is correcting decline from 1.2908 in wave (X) which is expected to give us 50-61.8 fibonacci retracement area (sell zone)
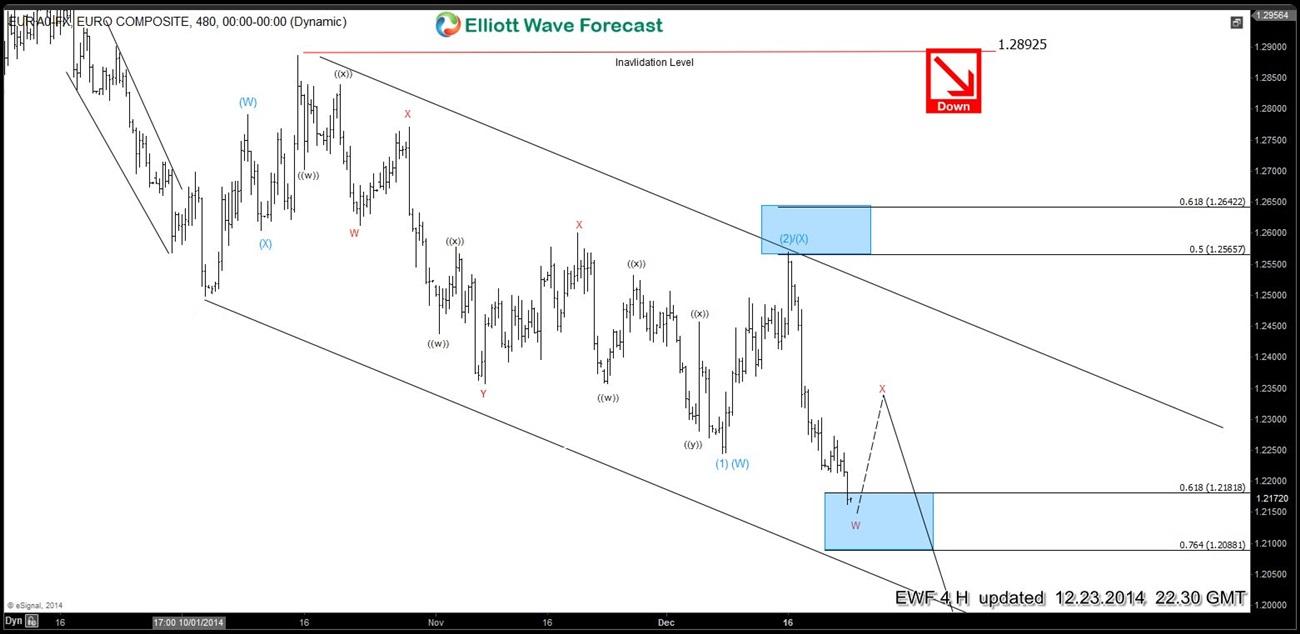
$EURUSD 12.23.2014. We’ve got a nice decline from 50 fib area as expected.
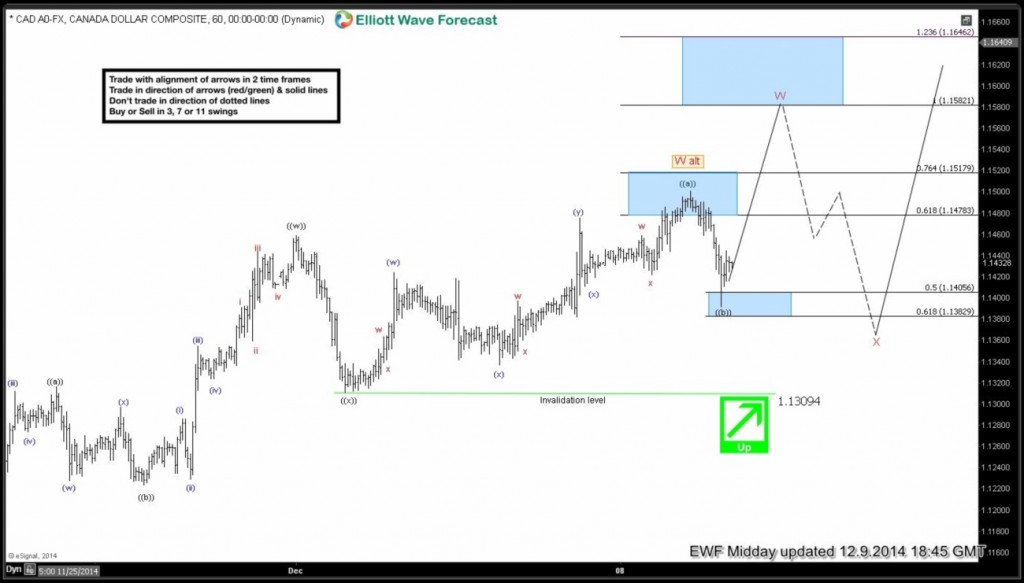
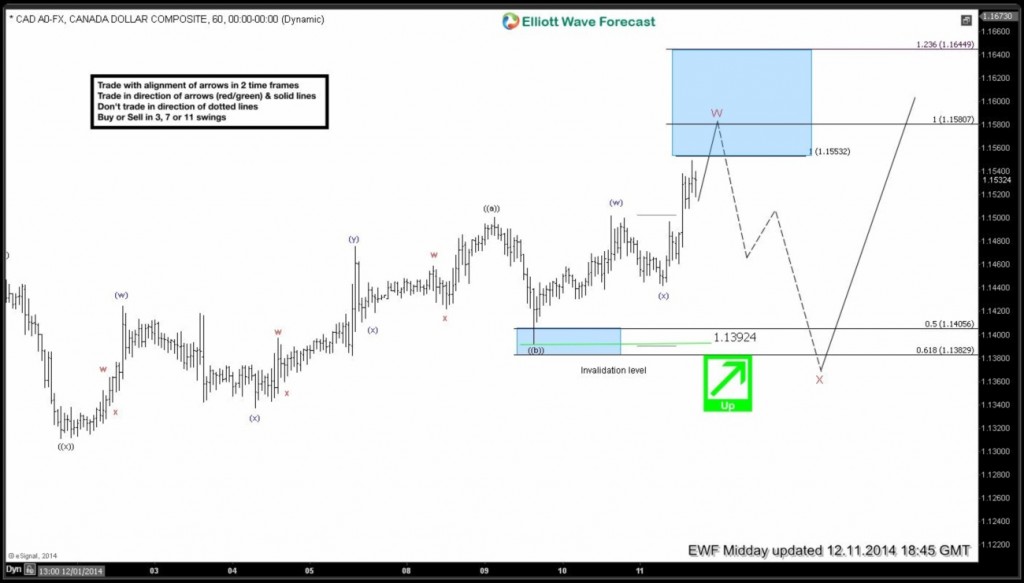
$USDCAD 12.9.2014. The pair has reached 50-61.8 fibonacci area as expected, pull back ((x)) is in place there & rally should follow.
$USDCAD 12.11.2014. The pair has turned higher as expected and now it’s approaching take profit zone.
Join us today !
 Elevate your trading with Elliott Wave Forecast!
 Ask unlimited questions during trading hours (Monday to Friday). Our Chat Rooms are an excellent place to learn, with continuous support from our market experts!
 Explore our expert insights and real-time analysis covering Forex, Indices, Commodities, Cryptocurrencies, Stocks, and ETFs across 78 instruments.
 Gain exclusive access to our Official Trading Recommendations in the Live Trading Room, where seasoned experts provide valuable insights and guidance on new trading opportunities.
 For just $0.99, unlock a wealth of knowledge and experience with our 14-day Trial. Experience firsthand our proven trading strategy, which accurately defines Entry, Stop Loss, and Take Profit levels, empowering you to make informed decisions with confidence.
 Ready to take the next step? Get your 14-day Trial in just a few clicks!


