Technical analysis, often called charting, is the study of market price action to identify trends, patterns, and potential trading opportunities. Traders use technical analysis to understand how an asset has moved in the past and to make more informed decisions about possible future price movements.
It can be applied across stocks, forex, commodities, indices, ETFs, and cryptocurrencies. By studying price charts, traders can identify market sentiment, support and resistance levels, trend direction, and potential entry and exit points.
Technical analysis is particularly useful for short- to medium-term trading because it focuses on price behavior, momentum, and market structure rather than only financial statements or economic data.
What Is Technical Analysis?
Technical analysis is a method of evaluating financial markets by studying historical price movements, chart patterns, trading volume, and technical indicators.
The central idea is that market price reflects available information and that price movements often form recognizable trends and patterns. Traders use this information to assess whether an asset may continue moving in the same direction, reverse, or enter a period of consolidation.
The four basic principles of technical analysis are:
- The market discounts everything: Available information is reflected in price.
- Prices move in trends: Markets generally move upward, downward, or sideways.
- History tends to repeat itself: Similar market psychology can create recurring chart patterns.
- Price action matters: Price is the primary source of information for technical traders.
Background and Evolution of Technical Analysis
Technical analysis has been used in financial markets for centuries. Early forms of chart-based trading can be traced to Japanese rice markets, where traders used price behavior to identify shifts in supply, demand, and market sentiment.
Later, Charles Dow helped establish many of the principles that still influence modern technical analysis. Dow Theory introduced the idea that markets move in trends and that price movements can provide important information about broader market conditions.
Today, traders use advanced charting platforms, indicators, algorithms, and automated tools. However, the foundation remains the same: studying price behavior to understand market direction and potential trading opportunities.
Learn more about the most common chart formations in our guide to trading patterns, including how traders use them to identify possible trend continuations and reversals.
How Elliott Wave Theory Can Strengthen Technical Analysis
Elliott Wave Theory can add another layer of structure to technical analysis by helping traders study market cycles, trend direction, and corrective price movements. The theory is based on the idea that markets often move in repeating waves driven by investor psychology: impulsive moves generally follow the main trend, while corrective moves develop against it.
When combined with support and resistance, Fibonacci levels, chart patterns, and momentum indicators, Elliott Wave analysis can help traders identify whether a market may be continuing a trend, forming a correction, or approaching a potential turning point. It should not be used as a guarantee of future price movement, but as part of a broader trading plan with clear risk management.
At Elliott Wave Forecast, we help traders apply technical analysis across stocks, ETFs, forex, indices, commodities, and cryptocurrencies. Our service provides structured Elliott Wave charts, market forecasts, technical videos, live analysis sessions, educational resources, and trading-room insights to help traders understand market structure and make more informed decisions.
Whether you are learning chart analysis or looking to refine an existing strategy, our approach combines Elliott Wave Theory with trend analysis, correlations, Fibonacci-based target areas, and disciplined risk management. Explore our complete guide to Elliott Wave Theory to learn how wave structure can be used alongside other technical analysis tools.

Why Price Charts Matter in Trading
Price charts are essential tools in technical analysis. They provide a visual record of how an asset has moved over time and help traders identify key market levels and price behavior.
By studying charts, traders can evaluate:
- Market trends
- Support and resistance levels
- Price momentum
- Breakouts and breakdowns
- Reversal signals
- Potential entry and exit zones
- Risk-management levels
Charts do not guarantee future outcomes, but they help traders create a structured trading plan rather than relying only on emotion or speculation.
Types of Price Charts
There are several types of price charts used in technical analysis.
- Line Charts
- Bar Charts
- Candlestick Charts
Line Charts
Line charts are the simplest type of price chart. They usually connect closing prices over a selected period.
They are useful for identifying the overall direction of a market and for viewing long-term trends without too much detail.
Bar Charts
Bar charts provide more detailed information by showing the opening price, highest price, lowest price, and closing price for each trading period.
This helps traders understand the range and volatility of price movement during a specific timeframe.
Candlestick Charts
Candlestick charts are among the most widely used tools in technical analysis. Each candlestick shows the opening price, closing price, high, and low for a selected period.
Candlesticks make it easier to identify momentum, buying pressure, selling pressure, and possible reversals. They are especially useful for spotting common candlestick patterns such as Doji, Hammer, and Shooting Star formations.
For a step-by-step approach to applying wave analysis in real markets, explore our complete Elliott Wave trading guide.
Importance of Chart Analysis in Trading
Chart analysis helps traders make more informed decisions by showing how price has behaved around important levels.
Understanding Market Trends
A chart can help determine whether an asset is in an uptrend, downtrend, or sideways range.
An uptrend typically forms higher highs and higher lows. A downtrend often creates lower highs and lower lows. A range-bound market moves between established support and resistance levels.
Recognizing the trend can help traders align their trades with prevailing market momentum.
Identifying Support and Resistance
Support is an area where buyers may enter the market and prevent price from falling further. Resistance is an area where sellers may enter and limit further price gains.
These levels are important because they can help traders identify possible turning points, breakout zones, and areas to manage risk.
Timing Entry and Exit Points
Technical analysis can help traders identify better entry and exit levels. For example, a trader may look for price to bounce from support before entering a long position or wait for a breakout above resistance before considering a trade.
Charts can also help identify stop-loss levels and profit targets.
See how to use Elliott Wave Forecast charts to identify market structure, track key price zones, and plan trades with greater confidence.
Managing Risk
Risk management is a major part of successful trading. Technical analysis helps traders place stop-loss orders below support, above resistance, or beyond key chart levels.
This can help limit losses if the market moves against the trade.
Most Common Technical Chart Patterns
Chart patterns are formations created by price movements. They can signal a possible continuation of the current trend or a potential reversal.
1. Head and Shoulders Pattern
The Head and Shoulders pattern is one of the most recognized reversal patterns in technical analysis.
It consists of three peaks:
- A left shoulder
- A higher middle peak called the head
- A right shoulder
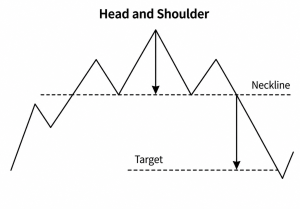
The pattern often signals that an uptrend may be losing momentum. A break below the neckline can confirm a potential bearish reversal.
The Inverse Head and Shoulders pattern is the opposite. It forms after a downtrend and may signal a possible bullish reversal.
2. Double Tops and Double Bottoms
A Double Top forms when price reaches a resistance area twice but fails to break higher. This may indicate that buying pressure is weakening and that a bearish reversal could develop.
A Double Bottom forms when price tests a support level twice and fails to move lower. This can indicate that selling pressure is weakening and that a bullish reversal may be possible.
3. Triangle Patterns
Triangle patterns are continuation patterns that form when price moves between converging trendlines.
The main triangle patterns are:
- Symmetrical triangles
- Ascending triangles
- Descending triangles
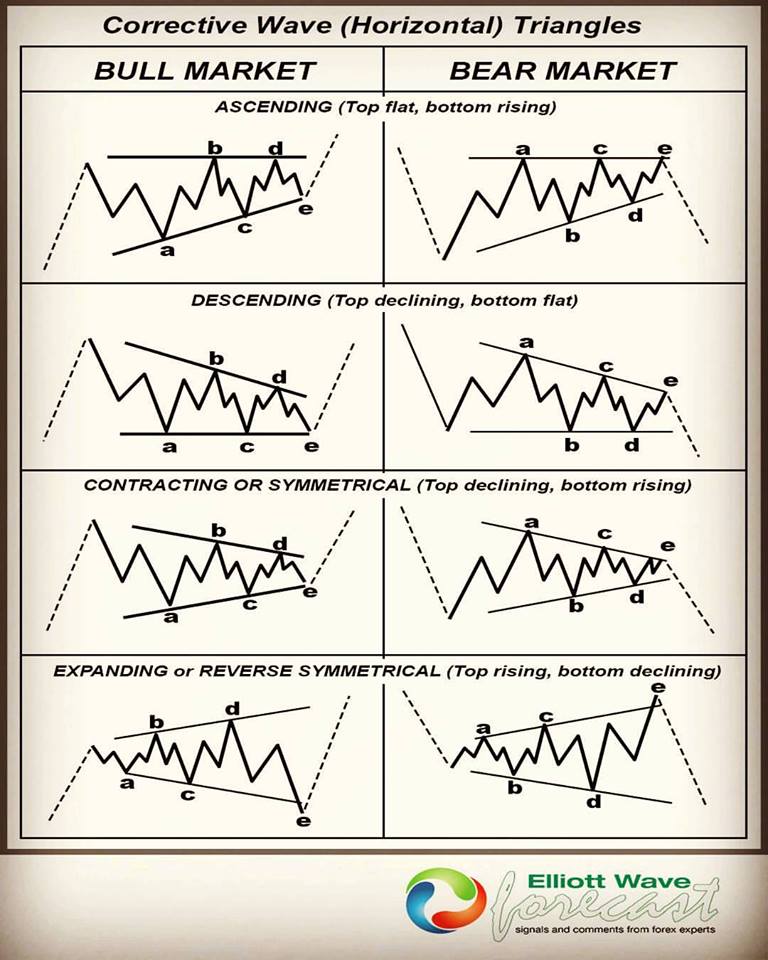
Triangles often appear during periods of consolidation before price makes a stronger move in either direction.
4. Rectangle Patterns
Rectangle patterns form when price trades between a clear support level and resistance level for a period of time.
This represents a consolidation phase where buyers and sellers are relatively balanced. A breakout above resistance or below support can signal the next major move.
5. Broadening Tops and Bottoms
Broadening patterns form when price swings become wider over time. They can indicate increasing volatility, uncertainty, and emotional trading activity.
These patterns may appear near major market turning points, but confirmation is important before acting on them.
Accurate wave labeling is essential for applying Elliott Wave Theory effectively. Learn how to identify and label market cycles in our guide to labeling Elliott Wave patterns.
Common Candlestick Patterns
Candlestick patterns can provide short-term clues about market sentiment.
1. Doji
A Doji forms when the opening and closing prices are very close together. It often reflects indecision between buyers and sellers.
A Doji does not always signal a reversal, but it can be important when it appears near support, resistance, or the end of a strong trend.
2. Hammer
A Hammer has a small body and a long lower wick. It usually appears after a decline and can signal that buyers are starting to push price higher.
3. Shooting Star
A Shooting Star has a small body and a long upper wick. It often appears after an upward move and can suggest that sellers are beginning to take control.
Benefits of Technical Analysis
Technical analysis offers several practical benefits for traders.
Better Decision-Making
Charts provide a visual representation of market behavior. This can help traders make decisions based on price action, trend structure, and key levels instead of emotion.
Clearer Entry and Exit Levels
Technical analysis helps identify potential buying zones, selling zones, stop-loss levels, and profit targets.
Improved Risk Management
By using support, resistance, trendlines, and chart patterns, traders can define risk before entering a trade.
Adaptability Across Markets
The same technical analysis principles can be used across different asset classes, including stocks, forex, commodities, indices, and cryptocurrencies.
Confidence Through Structure
A structured chart-based approach can help traders avoid impulsive decisions. It encourages planning, discipline, and consistency.
Technical Analysis and Fundamental Analysis
Technical analysis and fundamental analysis are not opposites. Many traders use both methods together.
Fundamental analysis focuses on factors such as earnings, interest rates, economic data, company performance, and industry conditions.
Technical analysis focuses on price behavior, trends, chart patterns, and momentum.
A trader may use fundamental analysis to identify an asset worth watching and technical analysis to determine a possible entry or exit point.
Common Technical Analysis Mistakes to Avoid
Technical analysis can be useful, but traders should avoid common mistakes.
- Overloading charts with too many indicators
- Ignoring broader market trends
- Trading every chart pattern without confirmation
- Ignoring risk management
- Relying only on technical analysis without considering major news or fundamentals
- Entering trades without a clear stop-loss level
- Chasing price after a large move has already happened
The goal is not to predict every market move perfectly. The goal is to create a disciplined process for evaluating probability, managing risk, and making informed decisions.
Conclusion
Technical analysis provides traders with a practical framework for understanding market behavior. By studying price charts, trends, support and resistance levels, chart patterns, and candlestick formations, traders can identify potential opportunities and manage risk more effectively.
Whether trading stocks, forex, commodities, indices, or cryptocurrencies, chart analysis can help traders make more structured decisions.
However, technical analysis works best when combined with patience, risk management, and a clear trading plan. No chart pattern or indicator guarantees success, but a consistent approach can help traders improve their decision-making over time.
Frequently Asked Questions
What is technical analysis in trading?
Technical analysis is the study of historical price action, chart patterns, trends, and indicators to identify potential market opportunities.
Are chart patterns reliable?
Chart patterns can be useful, but they are not guaranteed to work. Traders should wait for confirmation and use risk-management tools such as stop-loss orders.
Which chart is best for technical analysis?
Candlestick charts are widely used because they show opening, closing, high, and low prices clearly. However, line charts and bar charts can also be useful depending on the trading strategy.
Can technical analysis be used for forex and stocks?
Yes. Technical analysis can be applied to stocks, forex, commodities, indices, ETFs, and cryptocurrencies.
What is the difference between technical analysis and fundamental analysis?
Technical analysis studies price charts and market behavior. Fundamental analysis studies financial, economic, and business factors that may affect an asset’s value.


