What Is Technical Analysis?
Technical analysis is a method of evaluating financial markets by studying historical price movements, trading volume, and chart patterns. Unlike fundamental analysis, which focuses on economic and company data, technical analysis aims to identify recurring market patterns that can help traders anticipate future price movements.
Technical analysts believe that market psychology, investor sentiment, and supply-and-demand dynamics are reflected in price action. By analyzing charts and technical indicators, traders attempt to identify potential entry points, exit levels, profit targets, and market trends.
Technical analysis is widely used in stocks, forex, commodities, cryptocurrencies, ETFs, and indices, making it one of the most popular approaches to market forecasting.
The Three Core Principles of Technical Analysis
1. The Market Discounts Everything
Technical analysis assumes that all publicly available information is already reflected in market prices. This includes company earnings, economic news, interest rates, geopolitical events, and investor expectations.
Because of this, technical traders focus primarily on price action rather than external news sources.
2. Prices Move in Trends
One of the most important concepts in technical analysis is that prices tend to move in identifiable trends. Once a trend begins, it is more likely to continue than reverse immediately.
Understanding trend direction helps traders align their positions with prevailing market momentum and avoid trading against strong market movements.
3. History Tends to Repeat Itself
Financial markets are driven by human emotions such as fear, greed, optimism, and panic. Because human behavior remains relatively consistent over time, similar chart patterns and market structures often reappear.
This principle forms the foundation of chart pattern analysis, candlestick analysis, and Elliott Wave Theory.
How Technical Analysis Is Used in Trading
Technical analysis helps traders make objective trading decisions by identifying trends, support and resistance levels, trade setups, profit targets, and risk management levels.
Rather than relying on speculation, traders use technical tools to create repeatable trading plans based on observable market behavior.
Some of the most common uses of technical analysis include:
- Identifying market trends
- Finding support and resistance levels
- Determining trade entries
- Setting profit targets
- Managing risk with stop-loss orders
- Timing trade exits
- Measuring market volatility
- Confirming Elliott Wave structures
Types of Technical Analysis
Modern technical analysis consists of several specialized approaches that traders often combine together.
Trend Analysis
Trend analysis focuses on identifying whether a market is moving higher, lower, or sideways. Common tools include Moving Averages, MACD, and trendlines.
Candlestick Analysis
Candlestick patterns provide insights into market sentiment by analyzing individual candles and candle formations such as Doji, Engulfing Patterns, and Pin Bars.
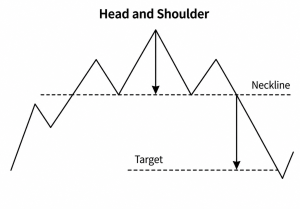
Chart Pattern Analysis
Chart patterns help traders identify potential continuation and reversal opportunities. Common patterns include:
- Double Top
- Double Bottom
- Triangle Patterns
- Flags and Pennants
- Wedges
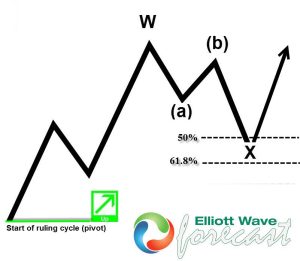
Elliott Wave Analysis
Elliott Wave Analysis is one of the most advanced forms of technical analysis. It classifies market movements into impulse waves and corrective waves to help traders anticipate future market direction.
Because Elliott Wave Theory incorporates market psychology and fractal behavior, it remains one of the most powerful forecasting methodologies available to traders.
Best Technical Indicators Used by Traders
Technical indicators help traders analyze price action from different perspectives.
Some of the most widely used indicators include:
- Moving Averages (MA)
- Relative Strength Index (RSI)
- Moving Average Convergence Divergence (MACD)
- Bollinger Bands
- Average True Range (ATR)
- Stochastic Oscillator
- On-Balance Volume (OBV)
- Fibonacci Retracement
- Average Directional Index (ADX)
- Volume Weighted Average Price (VWAP)
Each indicator serves a different purpose, including trend identification, momentum analysis, volatility measurement, and volume confirmation.
Technical Analysis vs Fundamental Analysis
While technical analysis focuses on price action and chart patterns, fundamental analysis evaluates assets based on earnings, economic data, industry performance, and financial health.
Many professional traders combine both approaches to gain a more complete understanding of market conditions.
Frequently Asked Questions
Does technical analysis really work?
Technical analysis does not predict markets with certainty. However, it helps traders identify high-probability scenarios, manage risk effectively, and make objective trading decisions.
What is the best technical indicator?
There is no single best indicator. Many traders combine Moving Averages, RSI, MACD, Fibonacci Retracements, and Elliott Wave Analysis to improve decision-making.
Is technical analysis suitable for beginners?
Yes. Beginners often start with trend analysis, support and resistance levels, candlestick patterns, and basic indicators before progressing to advanced methodologies such as Elliott Wave Theory.
Can technical analysis be used in all markets?
Technical analysis can be applied to stocks, forex, commodities, cryptocurrencies, ETFs, indices, and futures markets.
Conclusion
Technical analysis remains one of the most widely used approaches to market analysis because it provides a structured framework for understanding price behavior, identifying trends, and managing risk.
Whether using simple support and resistance levels or advanced techniques such as Elliott Wave Analysis, traders can improve their decision-making process by combining technical tools with proper risk management and disciplined execution.


