Elliott Wave Theory is one of the most powerful forms of technical analysis used to identify market trends, reversals, and high-probability trading opportunities. By studying recurring wave structures and market psychology, traders can better understand where price may move next across Forex, stocks, commodities, indices, and cryptocurrencies.
In this guide, we explore the practical application of Elliott Wave Theory using real market examples, Fibonacci relationships, and professional trading concepts used by analysts at Elliott Wave Forecast.
What Is Elliott Wave Theory?
Elliott Wave Theory is based on the idea that financial markets move in repetitive wave patterns driven by investor psychology and crowd behavior. These patterns repeat across all timeframes and markets, creating opportunities for traders to identify trends and turning points.
The theory is built around two primary structures:
- Impulse Waves (5-wave trending structure)
- Corrective Waves (3-wave counter-trend structure)
By identifying the current wave cycle, traders can forecast the next probable market move and align their trading strategy accordingly.
Why Traders Use Elliott Wave Analysis
Traders use Elliott Wave Analysis to better understand market structure, identify trend direction, and anticipate potential market reversals before they fully develop. By studying recurring wave patterns and momentum behavior, traders can identify high-probability trading setups and improve overall risk management.
One of the major advantages of Elliott Wave Theory is its ability to provide context across multiple timeframes. Traders can analyze the broader market trend on higher timeframes while using lower timeframes to refine entries and exits. This multi-timeframe approach helps traders stay aligned with the dominant trend while improving trade timing.
Unlike many traditional technical indicators that react after price movement has already occurred, Elliott Wave Analysis focuses on market structure and crowd psychology to anticipate future price action. This makes it a valuable tool for traders looking to identify potential opportunities before major market moves unfold.
Understanding Elliott Wave Cycle
Wave cycle analysis forms the foundation of Elliott Wave Theory. Traders use wave cycles to identify the current market phase and anticipate the next likely price movement. A complete Elliott Wave cycle typically consists of a five-wave impulse trend followed by a three-wave corrective structure. Understanding these cycles helps traders determine whether the market is trending or correcting within a larger price structure.
Wave Personalities In Elliott Wave Theory
Each Elliott Wave has its own “personality” and behavior.
For example:
- Wave 3 is usually the strongest and most aggressive trend wave
- Wave 2 tends to be deep and emotional
- Wave 5 often shows divergence and weakening momentum
Understanding elliott wave personalities helps traders confirm wave counts and anticipate future movement.
Elliott Wave Patterns & Market Structure
Wave patterns help traders identify whether a market structure is complete or still developing.
Common Elliott Wave patterns include:
- Impulse
- Zigzag
- Flat
- Triangle
- Double Three
- Triple Three
Recognizing these structures helps traders determine:
- trend continuation
- correction phases
- invalidation levels
- potential reversal zones
Fibonacci Ratios In Elliott Wave Analysis
Fibonacci ratios are an essential part of Elliott Wave Theory and play a major role in identifying high-probability trading setups. Traders use Fibonacci retracements and extensions to measure wave structures, estimate potential reversal areas, and project future price targets within a developing trend.
In practical market analysis, Fibonacci levels help traders identify possible entry zones, stop-loss placement areas, support and resistance regions, and realistic trend targets. These relationships also improve risk-to-reward planning by helping traders understand where a wave structure may complete or begin to reverse.
Most Elliott Wave structures tend to follow recurring Fibonacci relationships. Because of this, combining Fibonacci analysis with wave counting allows traders to build more accurate market forecasts and better understand the overall market structure.
The 3 Core Rules Of Elliott Wave Theory
There are three primary rules in Elliott Wave Theory:
Rule 1
Wave 2 cannot retrace beyond the start of Wave 1.
Rule 2
Wave 3 cannot be the shortest impulse wave.
Rule 3
Wave 4 cannot overlap Wave 1 in a standard impulse structure.
These rules help traders validate wave counts and avoid incorrect analysis.
Practical Challenges Of Elliott Wave Trading
While Elliott Wave Theory is a powerful analytical tool, applying it in real market conditions can often be challenging. Market structures are constantly evolving, wave counts may shift as new price action develops, and multiple valid scenarios can exist at the same time. In many cases, wave patterns only become fully clear in hindsight, which is why experience and adaptability are essential when using Elliott Wave Analysis in live trading environments.
Because of these complexities, professional Elliott Wave analysis requires a deep understanding of market structure, continuous market observation, multi-timeframe analysis, and disciplined risk management. Traders who successfully apply Elliott Wave Theory typically combine technical experience with patience and flexibility to adapt to changing market conditions.
Practical Elliott Wave Examples
USDCHF Elliott Wave Analysis
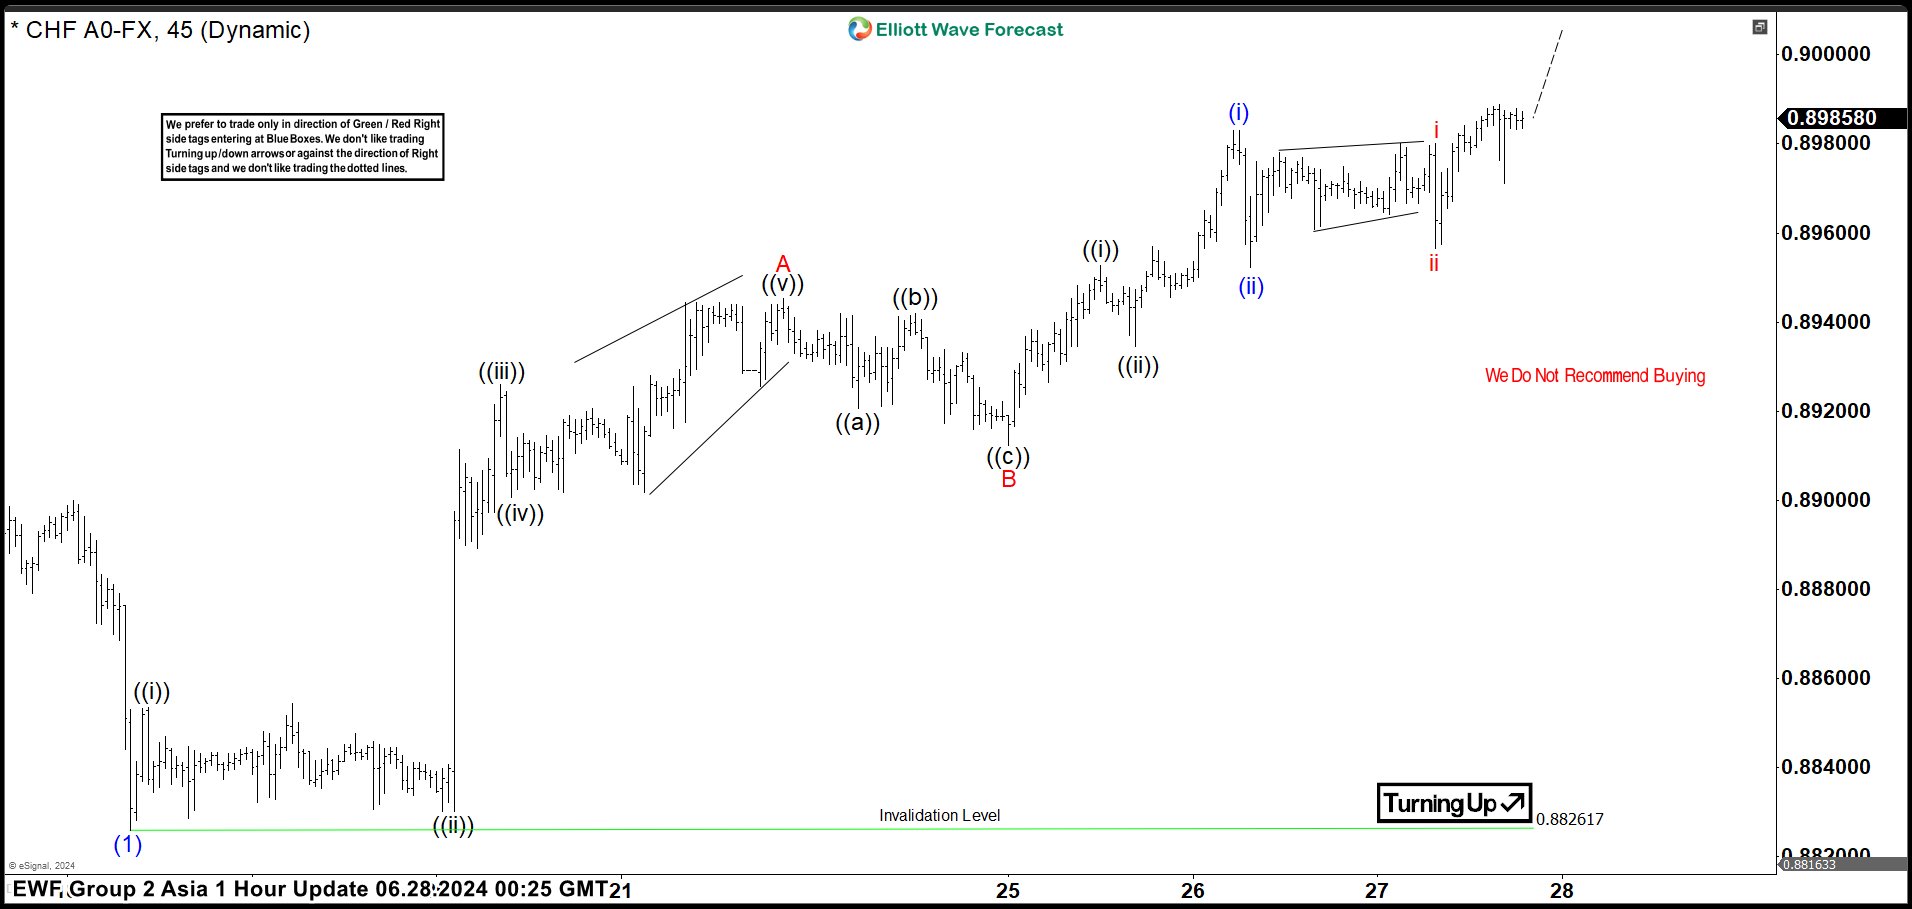
Short Term Elliott Wave in USDCHF suggests pair ended the move down from 5.1.2024 high as wave (1) at 0.882. Wave (2) corrective rally is now in progress to correct cycle from 5.1.2024 high. Internal subdivision of wave (2) is unfolding as a zigzag Elliott Wave structure. Up from wave (1), wave ((i)) ended at 0.8853 and dips in wave ((ii)) ended at 0.883. Pair extended higher in wave ((iii)) towards 0.8926 and pullback in wave ((iv)) ended at 0.89. Final leg wave ((v)) ended at 0.8945 which completed wave A in higher degree.
Down from wave A, wave ((a)) ended at 0.892 and rally in wave ((b)) ended at 0.8942. Wave ((c)) lower ended at 0.8912 which completed wave B in higher degree. Pair has resumed higher in wave C. Up from wave B, wave ((i)) ended at 0.895 and pullback in wave ((ii)) ended at 0.8934. Pair extended higher in wave (i) towards 0.8983 and pullback in wave (ii) ended at 0.8952. Up from there, wave i higher ended at 0.898 and pullback in wave ii ended at 0.8956. Near term, as far as pivot at 0.882 low stays intact, expect pullback to find support in 3, 7, or 11 swing and pair to extend higher end support in 3, 7, or 11 swing for further upside.
XOM Elliott Wave Weekly Analysis
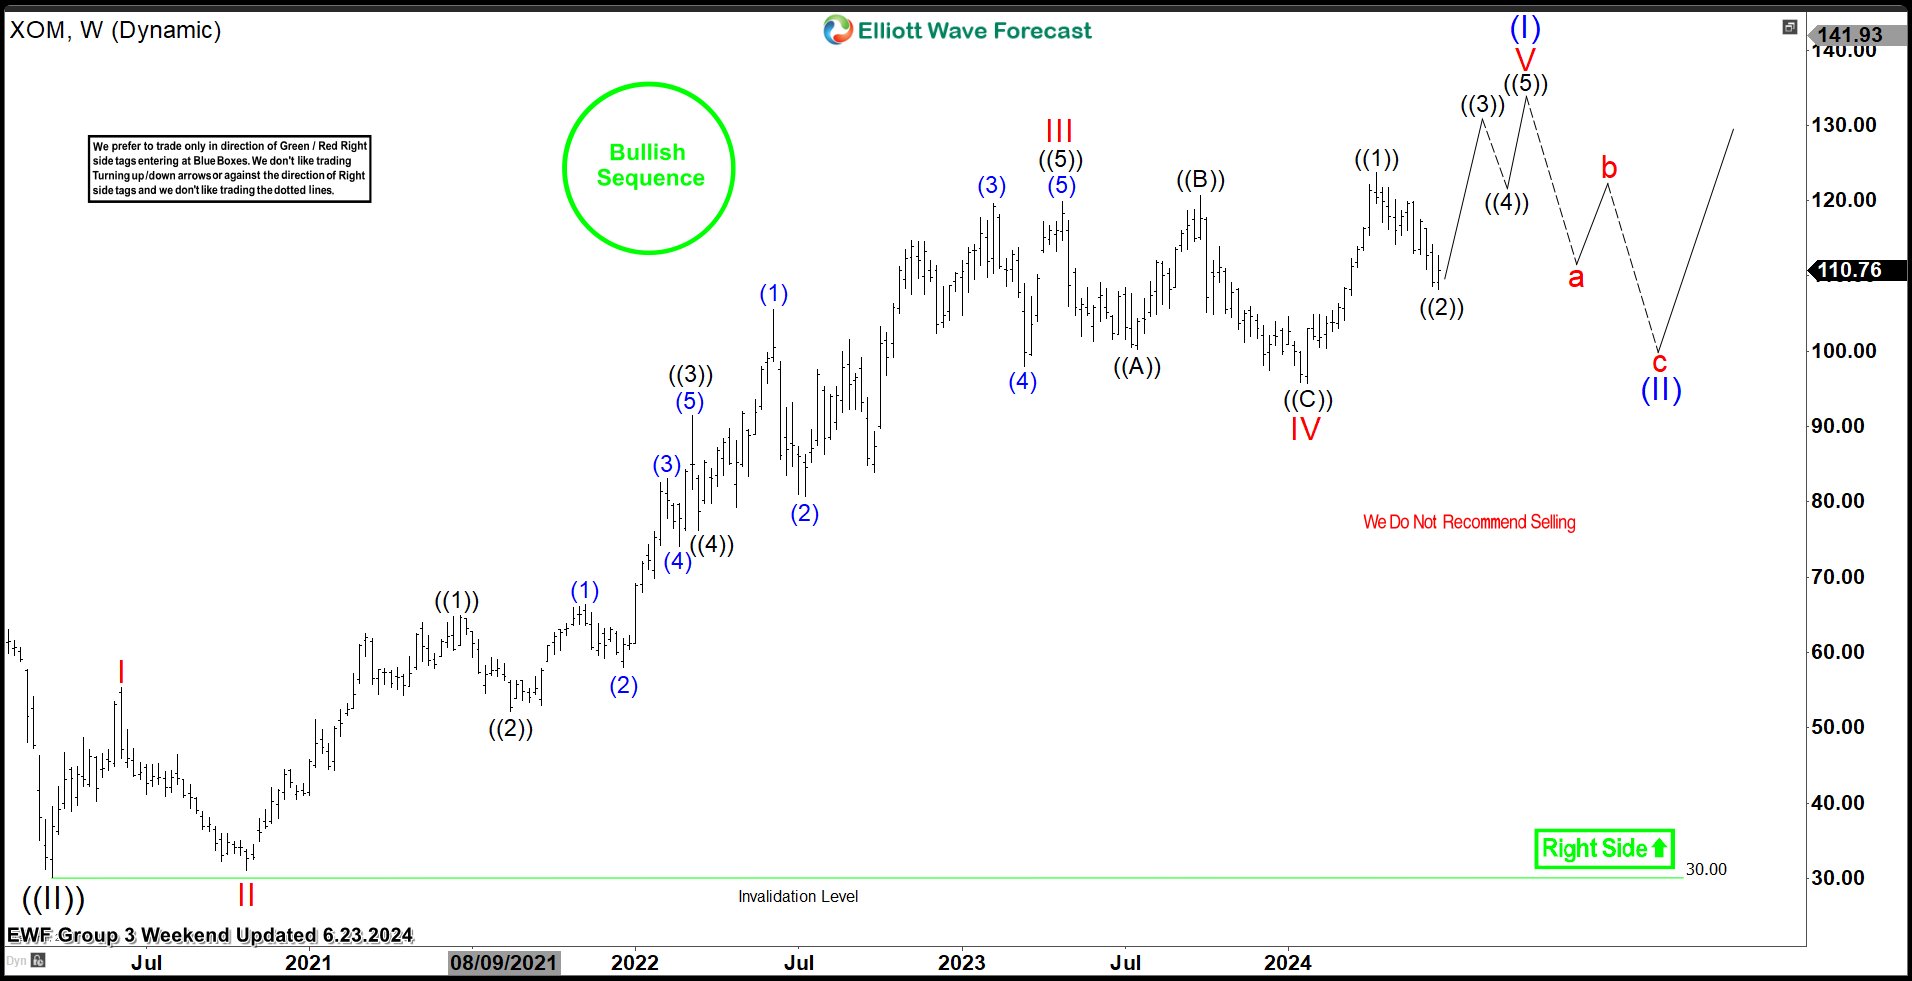
The weekly chart shows XOM in a bullish sequence within wave V of (I) of ((III)) from the 23rd October weekend update. It shows that the price is correcting in wave ((2)) of V. Wave ((1)) reached a fresh all-time high, surpassing the September 2023 high. From this top, the price corrected in wave ((2)) for over two months. We anticipate wave ((3)) will start and lead to another all-time high after breaching the peak of wave ((1)). The best trading strategy is to identify a clear trend and buy dips in a bullish sequence or sell bounces in a bearish sequence. After seeing this chart on June 23, 2024, our members knew to buy the pullback at the extreme of a 3, 7, or 11 swing from the blue box. So, where would we buy? We look for opportunities in the lower time frames.
Elliott Wave Theory & Fractal Market Behavior
One of the most fascinating aspects of Elliott Wave Theory is its fractal nature.
Market structures often appear similar across:
- hourly charts
- daily charts
- weekly charts
- monthly charts
This self-similar behavior is known as fractal market structure.
Subscribe to get Charts Update Now.
According to Elliott, large market crashes and small corrections often share the same structural characteristics — only on different scales.
This fractal behavior explains why Elliott Wave Theory can be applied across virtually all financial markets and timeframes.

Conclusion
Elliott Wave Theory remains one of the most effective methods for understanding market structure and forecasting future price movements. With experience, market observation, and disciplined analysis, traders can use Elliott Wave Theory to identify trends, anticipate reversals, improve timing, and manage risk more effectively.
As financial markets continue evolving, Elliott Wave Analysis remains a valuable tool for traders seeking structured, probability-based market insight across Forex, stocks, commodities, and crypto markets.
FAQs
What is Elliott Wave Theory?
Elliott Wave Theory is a form of technical analysis that identifies recurring market wave patterns to forecast future price movements.
How accurate is Elliott Wave Analysis?
When applied correctly with Fibonacci ratios and market structure, Elliott Wave Analysis can help traders identify high-probability setups and trend reversals.
Can Elliott Wave be used in Forex trading?
Yes, Elliott Wave Theory is widely used in Forex, stocks, commodities, indices, and crypto markets.
What are the 3 rules of Elliott Wave Theory?
- Wave 2 cannot retrace beyond Wave 1
- Wave 3 cannot be the shortest impulse wave
- Wave 4 cannot overlap Wave 1 in most impulse structures


