Triangles are one of the most important corrective patterns in Elliott Wave Theory, helping traders identify consolidation phases and anticipate high-probability breakout opportunities.
These patterns consist of five waves (A-B-C-D-E) forming a 3-3-3-3-3 structure, typically appearing before the final move in a trend.
What Is a Triangle in Elliott Wave Theory?
A triangle in Elliott Wave is a sideways corrective pattern that reflects a temporary balance between buyers and sellers before trend continuation.
Triangles commonly appear in:
- Wave 4 of an impulse
- Wave B of a correctionThese structures also appear in double and triple combinations.
- Wave X in complex structures
Learn the basics of Elliott Wave Theory before diving deeper.
Key Features of Triangle Patterns
- 5-wave structure (A-B-C-D-E)
- Subdivides into 3-wave moves (corrective)
- Forms converging or horizontal trendlines
- Price action is sideways and overlapping
- Ends with a strong breakout (terminal thrust)
💡 The breakout move is often equal to the widest part of the triangle.
Types of Triangle Patterns in Trading
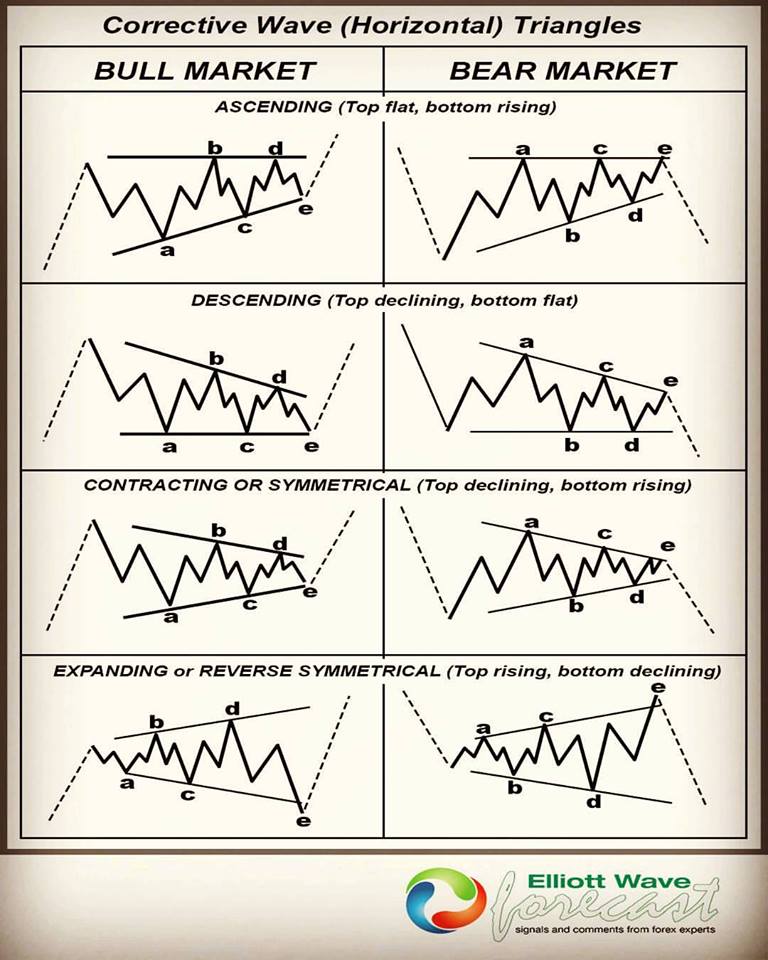
1. Ascending Triangle (Bullish Continuation)
An ascending triangle is a bullish pattern that forms during an uptrend.
Characteristics:
- Higher lows (rising support)
- Flat resistance level
- Increasing buying pressure
Get to know about elliott wave corrective patterns.
Trading Strategy:
- Enter after breakout above resistance
- Confirm with volume
- Place stop-loss below support
2. Descending Triangle (Bearish Continuation)
A descending triangle is a bearish continuation pattern that signals downside movement.
Characteristics:
- Lower highs (falling resistance)
- Flat support level
- Increasing selling pressure
Trading Strategy:
- Enter after breakdown below support
- Use stop-loss above resistance
- Measure target using pattern height

3. Contracting Triangle (Neutral Consolidation)
A contracting triangle forms when both trendlines converge, signaling decreasing volatility.
Characteristics:
- Lower highs + higher lows
- Declining volume
- Gradual breakout
Trading Strategy:
- Watch B–D trendline break
- Expect retest before continuation
- Confirm with indicators
Advanced Elliott Wave Triangle Insights
- Wave E may overshoot or undershoot trendlines
- One subwave can form a smaller triangle
- Running triangles occur when Wave B exceeds Wave A
These variations often signal strong trend continuation.
Common Mistakes Traders Make
- Entering before breakout confirmation
- Ignoring volume signals
- Misidentifying wave structure
- Trading triangles in Wave 2 (invalid)
How to Trade Triangle Patterns Effectively
To maximize accuracy:
- Combine with RSI & MACD indicators
- Confirm with Elliott Wave structure
- Wait for strong breakout confirmation
- Always use stop-loss
Check real-time forecasts to see how professionals apply this strategy.
FAQs
What is a triangle in Elliott Wave?
A triangle is a 5-wave corrective pattern that moves sideways before a trend continuation.
Are triangles bullish or bearish?
They can be both—ascending triangles are bullish, descending are bearish.
Where do triangles occur in Elliott Wave?
Usually in Wave 4, Wave B, or Wave X.
How do you trade triangle breakouts?
Wait for breakout confirmation with volume and enter in the direction of the trend.
Conclusion
Elliott Wave triangle patterns are powerful tools for identifying market consolidation and breakout opportunities. By understanding ascending, descending, and contracting triangles, traders can improve timing, reduce risk, and trade with greater confidence.
For best results, always combine triangle analysis with technical indicators and proper risk management.


