

In this Elliott Wave update, we look at the latest structure in the First Trust Natural Gas ETF ($FCG). The ETF has been showing a strong bullish sequence from the 2020 lows, where a double nest appears to have formed and helped launch the larger rally. More recently, FCG seems to have ended the cycle from April 2025 and has started a corrective pullback. However, the decline still looks corrective rather than impulsive. As a result, the ETF is now pulling back in 3 swings, and the Blue Box Area is standing out as the next buying opportunity.
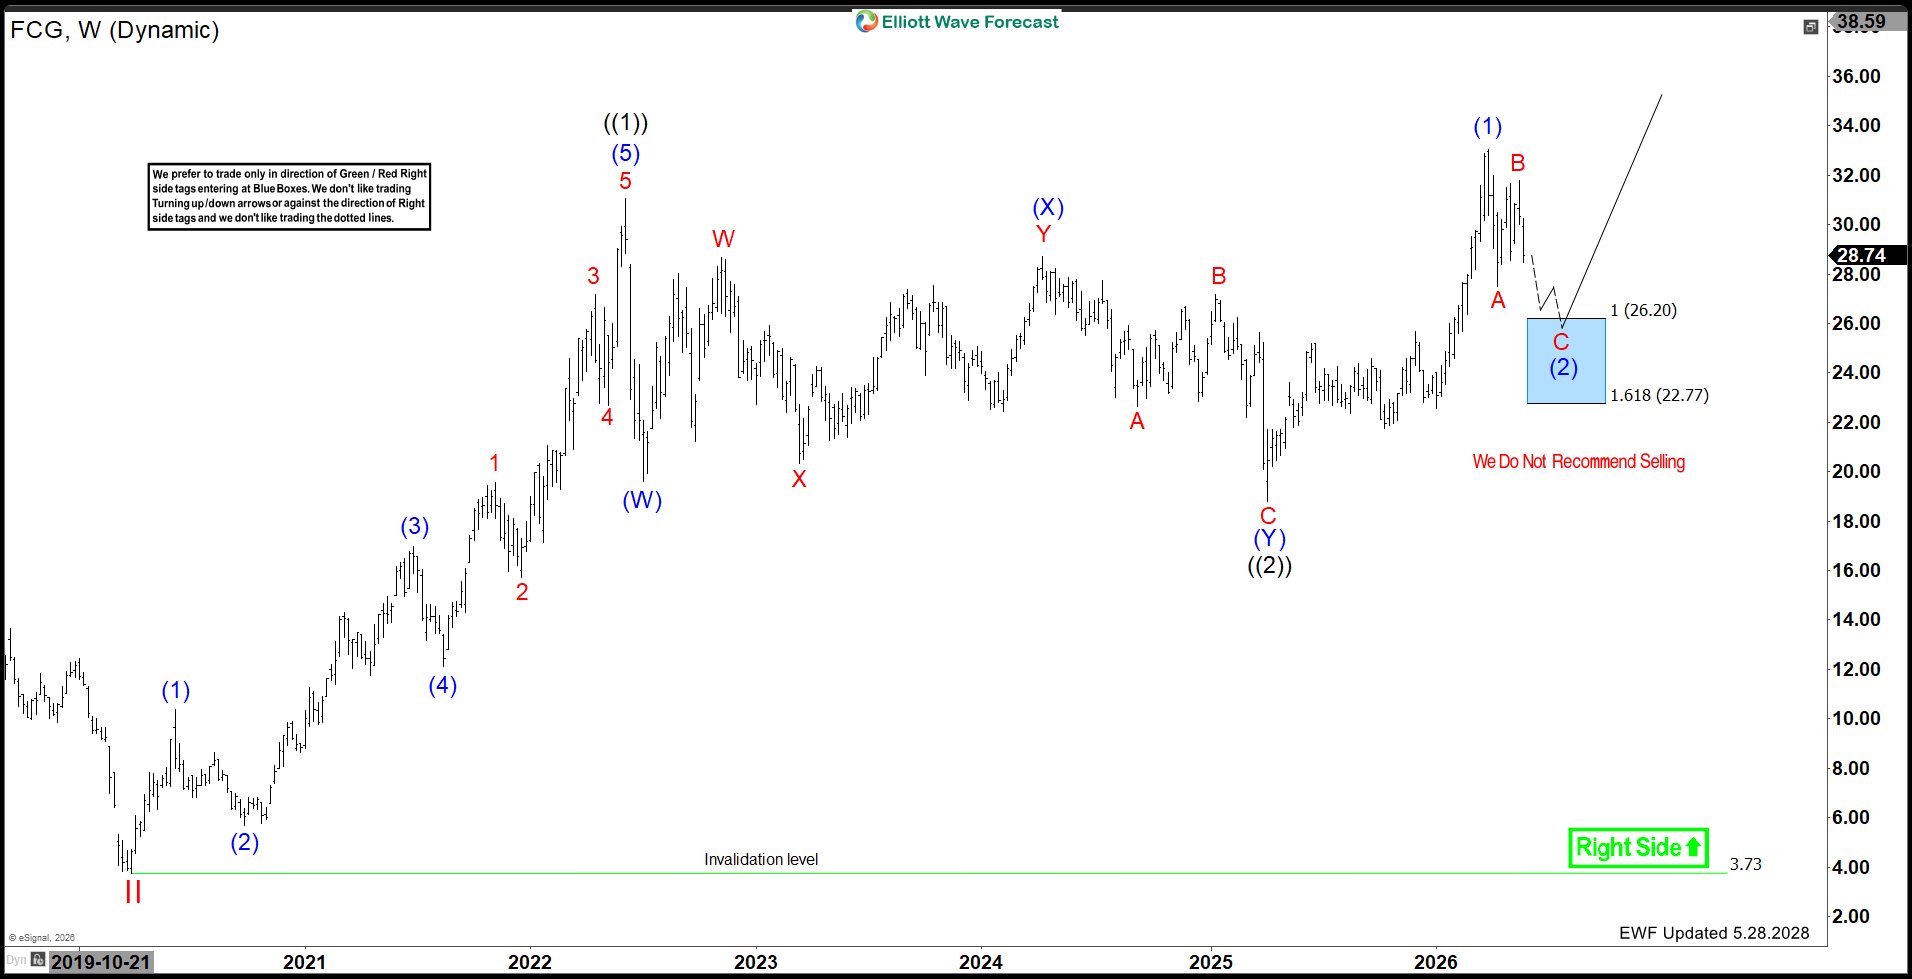 FCG Built a Double Nest From the 2020 Lows
Looking at the weekly chart, $FCG formed an important base at the 2020 lows and then began to rally in a bullish impulsive structure. The price action from that low suggests a double nest, which is a bullish Elliott Wave setup that often leads to a strong extension higher.
That larger bullish structure helped support the rally into the 2022 high and then again into the more recent advance. Therefore, the bigger picture remains constructive, even though the ETF is currently correcting the latest cycle.
Cycle From April 2025 Appears Complete
From the April 2025 low, $FCG advanced in another bullish leg and eventually reached a meaningful peak in 2026. After that high, the ETF failed to extend immediately and turned lower in a corrective sequence.
This shift suggests the cycle from April 2025 has likely ended for now. Even so, the current move lower does not yet show the characteristics of a larger bearish trend. Instead, it looks like a correction within the broader bullish sequence from the 2020 low.
Pullback Is Unfolding in 3 Swings
At this stage, $FCG is not declining in a straight five-wave impulsive move. Instead, the structure points to a 3-swing correction, which is a common Elliott Wave pattern after a completed bullish cycle.
More specifically, the current decline is unfolding as a A-B-C structure. This is important because 3-swing pullbacks often end in extreme areas where selling pressure fades and buyers step back in. Therefore, the current weakness should be viewed as a corrective pullback rather than the start of a major bearish reversal.
Blue Box Area Offers Buying Opportunity
Most importantly, the Blue Box Area between 26.20 and 22.77 marks the next key support zone. This is where the 3-swing pullback can complete and where buyers are expected to appear.
Typically, Blue Box Areas represent high-frequency reaction zones where the market reaches an extreme in a corrective structure. In this case, if $FCG reaches that region, buyers can step in and trigger a reaction higher in line with the larger bullish trend.
For that reason, we do not like selling into the blue box. Instead, the preferred view is to watch that area for a buying opportunity as the correction matures.
Near-Term Outlook for $FCG
In the near term, the focus remains on the decline into 26.20–22.77. As long as the current move continues to unfold as a corrective structure, that area remains the next important support to watch.
Once the ETF reaches the blue box, a bounce can develop and confirm that buyers are defending the larger bullish sequence. That would fit the view that the pullback is only correcting the cycle from April 2025, while the bigger trend from the 2020 lows remains intact.
Meanwhile, the broader structure remains valid above the 3.73 invalidation level.
Technical Summary
To summarize, $FCG shows a bullish double nest from the 2020 lows and appears to have ended the cycle from April 2025. The ETF is now pulling back in a 3-swing correction, and the Blue Box Area at 26.20–22.77 stands out as the next buying opportunity.


