Hut 8 Corp (NASDAQ: HUT) more than doubled earlier this year. Then, it started a correction from its June peak. In today’s video blog, we inspect its current Elliott Wave structure. Our analysis explains the potential upside target based on this technical setup.

Elliott Wave Analysis

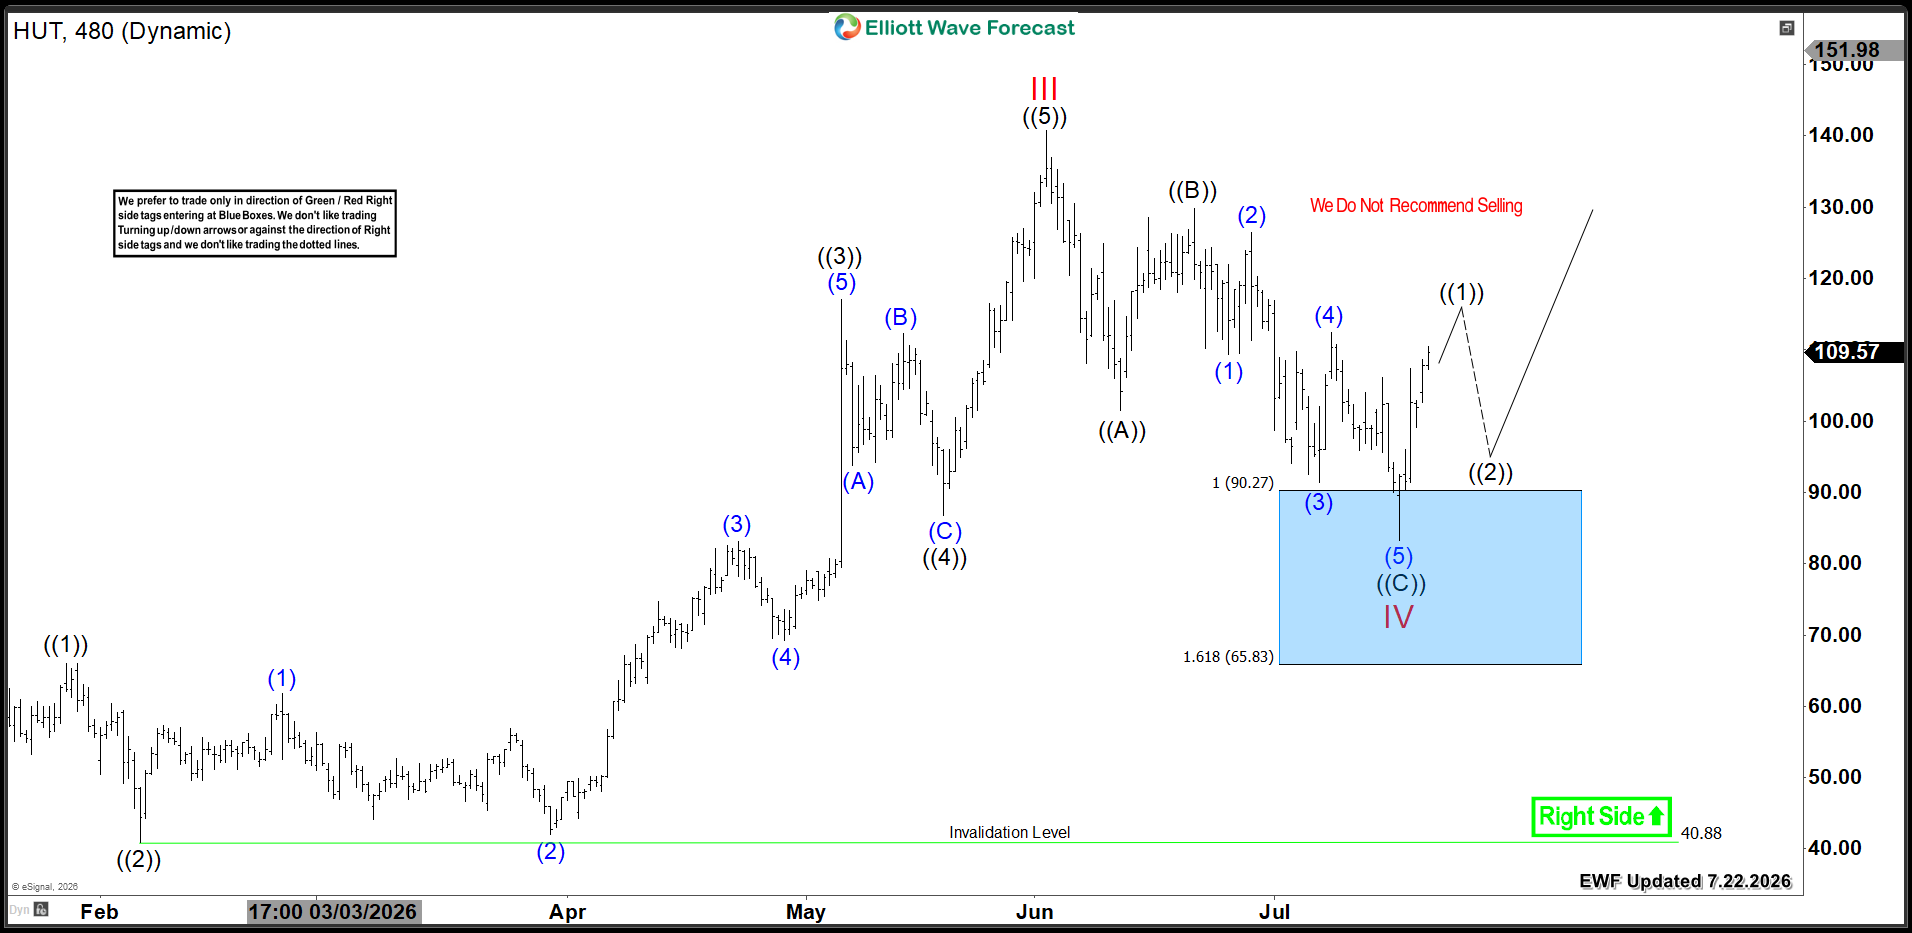
HUT completed a five-wave advance in wave III at $66.07 in June 2026. Since then, it formed a three-wave zigzag structure (A-B-C). Wave ((A)) ended at $101.5. Subsequently, wave ((B)) bounced to $129.88. Then, wave ((C)) traded lower into the buying Blue Box at the equal legs area $90.27 – $65.83 .

Wave IV is marked at the recent low of $83.30. From there, the stock is reacting to the upside. It will either resume the rally to new highs or bounce in three waves at minimum. As long as HUT stays above $83.30, it should aim for the upside target $154 – $176 .

However, if the stock fails to break into new highs, it could turn lower again. A double three correction in wave IV would then unfold. This would push HUT below $90 again. That would create another buying opportunity at the next extreme area.

HUT 8 Hour Chart 7.22.2026

HUT 8H Chart 7.22.2026

The following video offers a technical outlook for HUT Corporation:

Conclusion

HUT maintains a strong bullish trend. The stock appears ready for a new upside extension. However, bulls should remain cautious. Another dip remains a possibility.

Get More Insights Today

Learn to trade our Blue Boxes using the 3, 7, or 11 swings sequence. Try our services with a 14-day trial.

You will gain access to:

  • 78 instruments updated across 4 different time frames

  • Live Trading & Analysis Sessions with our Expert Analysts every day

  • 24-hour chat room support and much more

Explore our system to gain deeper insights into this methodology.