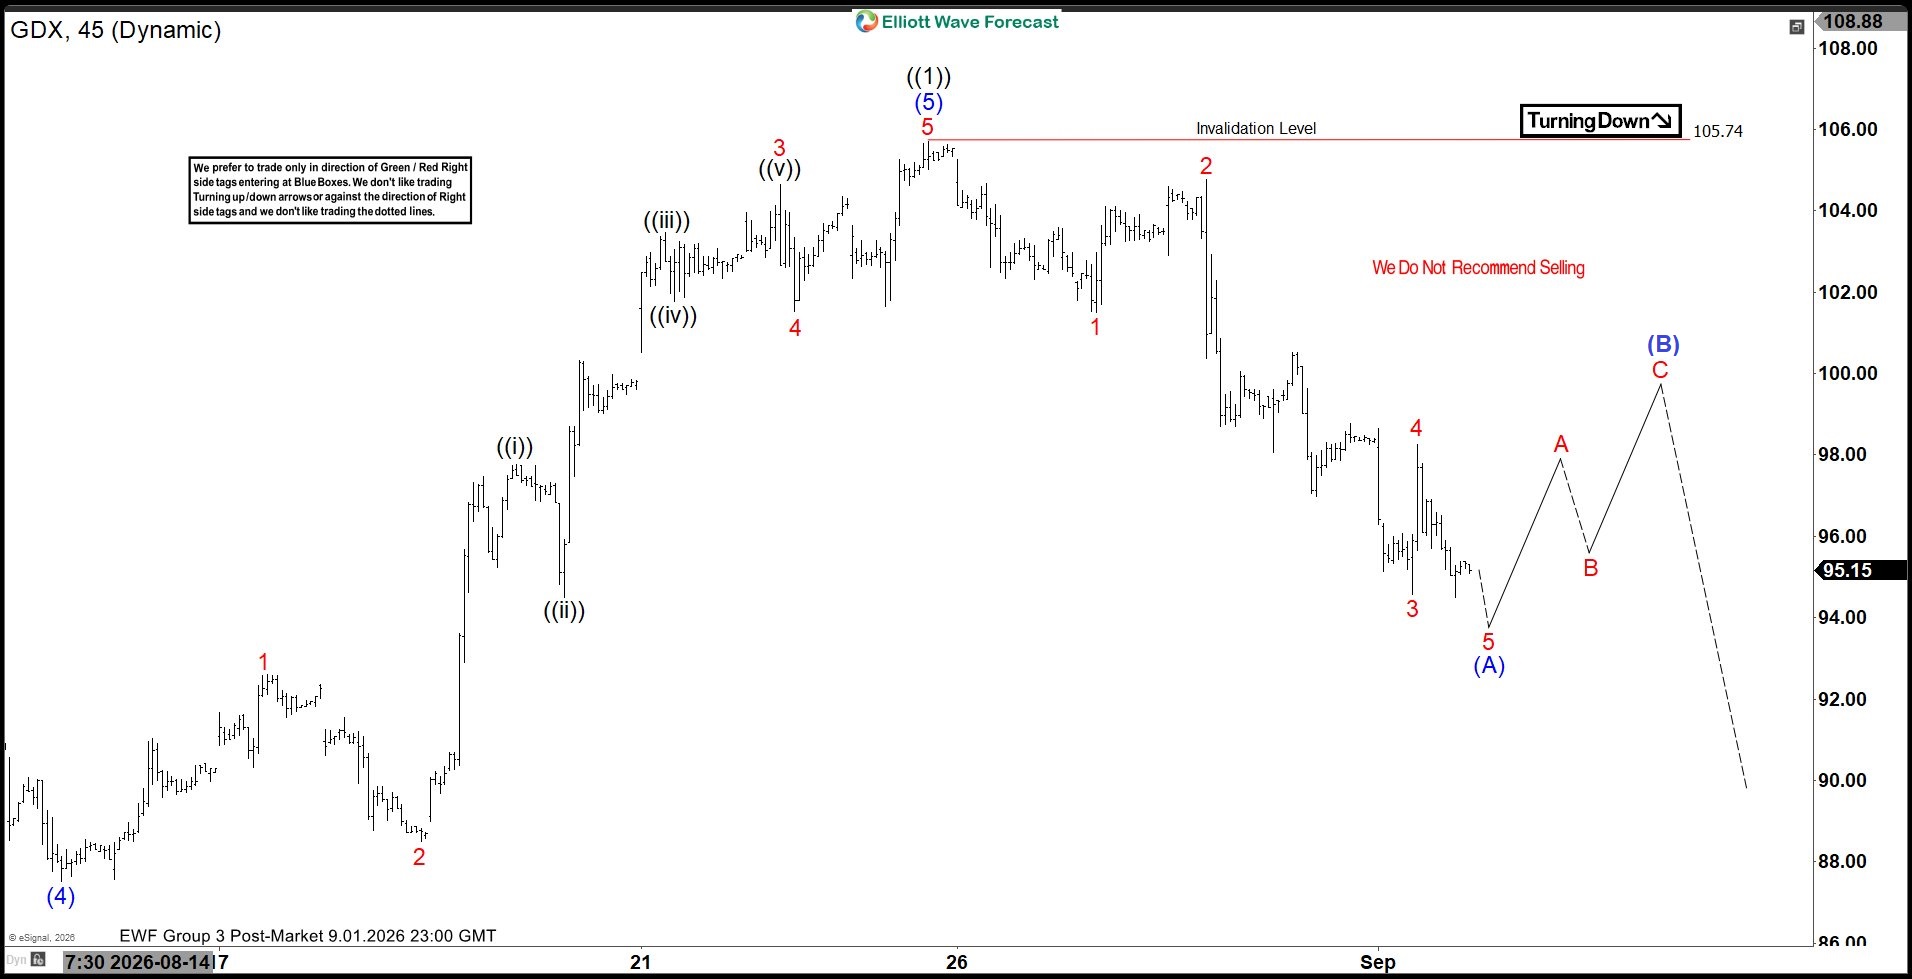
Short‑term Elliott Wave analysis in the Gold Miners ETF (GDX) indicates that the cycle from the July 17 low has ended as an impulsive advance, with wave ((1)) reaching 105.74. The ETF has now begun a larger‑degree correction in wave ((2)), unfolding with internal subdivision as a zigzag structure. The initial decline from wave ((1)) produced wave 1, which ended at 101.5. A rally in wave 2 followed that reached 104.78. Selling pressure then resumed, and wave 3 pushed the ETF down to 94.58. A subsequent recovery in wave 4 lifted prices to 98.26. The instrument is now progressing through wave 5, which should complete wave (A) of the zigzag once it finishes.
After wave (A) ends, the ETF should attempt a corrective rally in wave (B). This move will retrace part of the decline from the wave ((1)) peak before the ETF turns lower again to continue the broader corrective phase. In the near term, the pivot at the 105.74 high provides a clear risk parameter. As long as this level holds, any rally is expected to fail in three or seven swings, allowing further downside to resume as part of the larger‑degree correction.