In this Elliott Wave update, we take a look at the long-term structure in Invesco S&P 500 Equal Weight Health Care ETF ($RSPH). The ETF appears to be breaking out after nearly 5 years of sideways consolidation, and the latest price action suggests a larger bullish sequence may now be underway. More importantly, the structure points to the potential for $40+ in the next few quarters if the current breakout continues to develop.
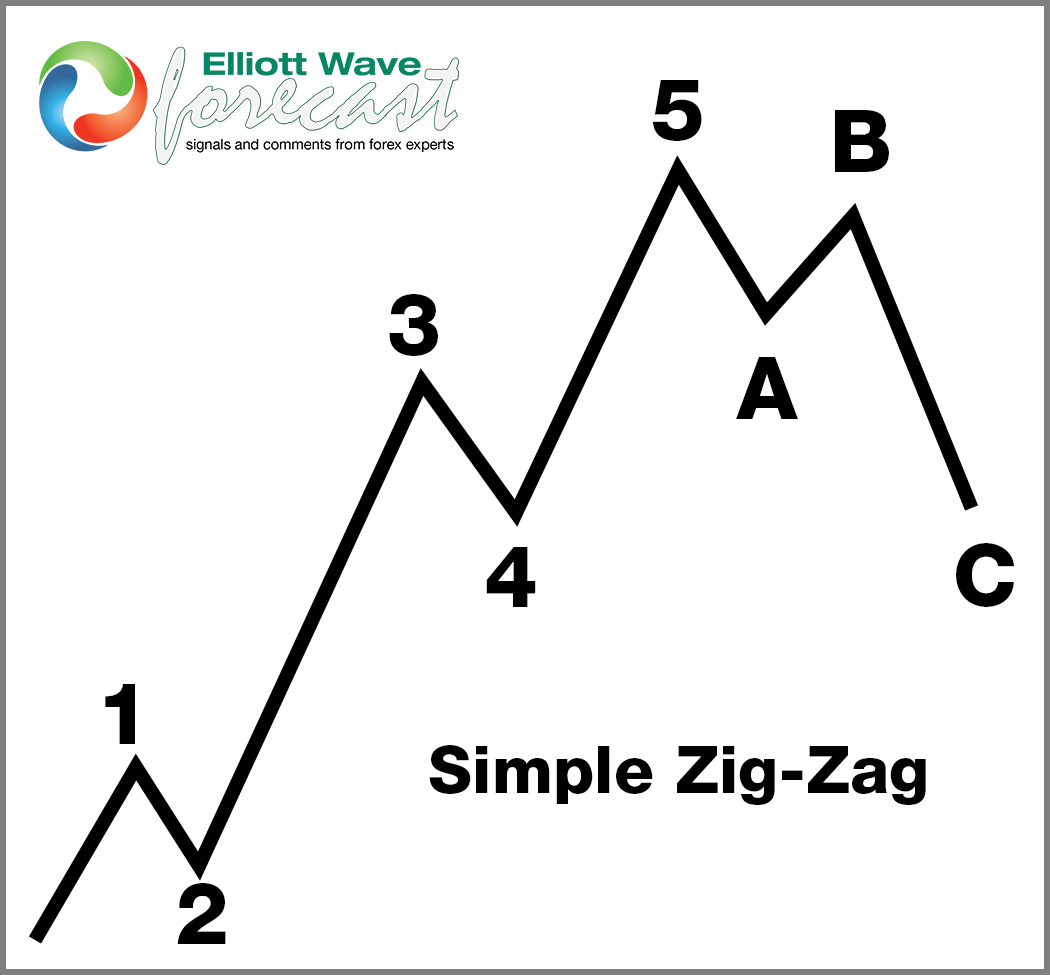
5 Wave Impulse + ABC correction
$RSPH Spent Nearly 5 Years in Sideways Consolidation
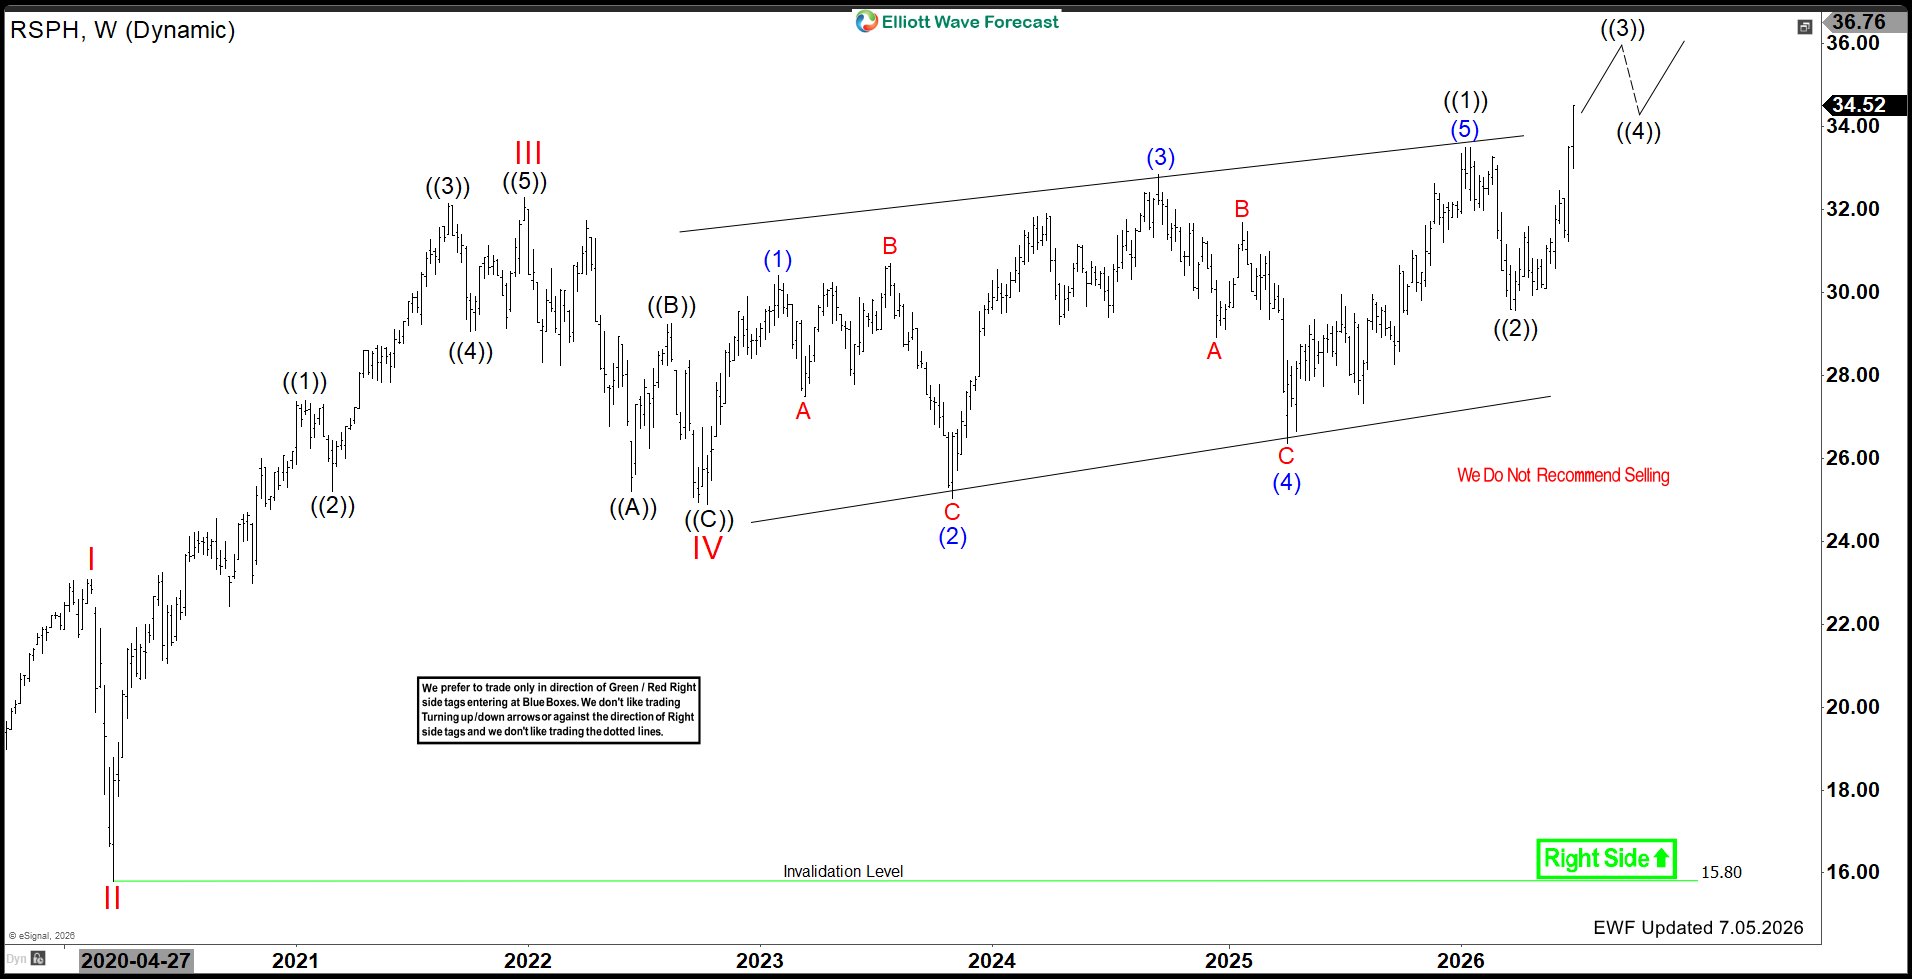 Looking at the weekly chart, $RSPH has traded in a broad sideways range for several years. Since 2021, price has moved in overlapping swings rather than a sustained trend, which supports the idea of a prolonged consolidation phase.
That long base matters because markets often build energy during these multi-year consolidations before a larger directional move begins. In this case, the recent push higher suggests $RSPH may finally be starting to resolve that range to the upside.
5-Wave Diagonal From 2022 Ended in January 2026
From the 2022 low, $RSPH advanced in what looks like a 5-wave diagonal, and that structure appears to have ended in January 2026. After that peak, the ETF turned lower in a corrective move rather than continuing higher right away.
This is important because ending diagonals often mark the completion of one bullish leg before a pullback takes place. Therefore, the decline that followed January 2026 fit well as a correction rather than the start of a larger bearish trend.
March 30, 2026 Low May Have Completed Wave ((2))
After the January 2026 high, $RSPH pulled back and appears to have found an important low on March 30, 2026. From an Elliott Wave perspective, that decline can be counted as wave ((2)).
If that view is correct, then the ETF has already started wave ((3)) to the upside. That would explain the strong rebound from the March 30 low and the recent breakout above the upper boundary of the multi-year consolidation structure.
Breakout Suggests More Upside Is Ahead
Most importantly, $RSPH now looks to be breaking out of the long consolidation range. This breakout improves the bullish outlook because it suggests the market is transitioning from a sideways environment into a trending phase.
As long as the breakout holds, the next leg higher can continue to extend. Consequently, the current structure supports the idea that $RSPH can work its way toward $40+ in the next few quarters.
Why $40+ Is in Focus
The $40+ area stands out as the next meaningful upside objective as wave ((3)) continues to unfold. Third waves often carry strong momentum, especially when they begin after a long consolidation and a completed corrective pullback.
For that reason, if buyers continue to defend the breakout and the March 30 low remains in place, $RSPH can continue to build on the current advance and target higher levels over the medium term.
Near-Term Outlook for $RSPH
In the near term, the focus remains on whether $RSPH can hold above the breakout area and continue printing higher highs and higher lows. As long as that happens, the bullish sequence remains intact.
Meanwhile, the March 30, 2026 low remains the key reference point. Holding above that low keeps the view alive that wave ((2)) already ended and that wave ((3)) is now in progress.
Technical Summary
To summarize, $RSPH appears to be breaking out after nearly 5 years of sideways consolidation. The 5-wave diagonal from 2022 appears to have ended in January 2026, and the pullback likely found its low on March 30, 2026.
Video Analysis


