

In this Elliott Wave update, we examine the long-term structure in VanEck Oil Services ETF ($OIH). The ETF continues to display a bullish double nest from the 2020 lows, which supports the idea of additional upside over the longer term. More importantly, $OIH recently tested the highlighted support area and produced a strong reaction higher. As long as that support continues to hold, the bullish sequence can eventually extend toward the $624 area over the next few quarters.
$OIH Shows a Double Nest From the 2020 Lows
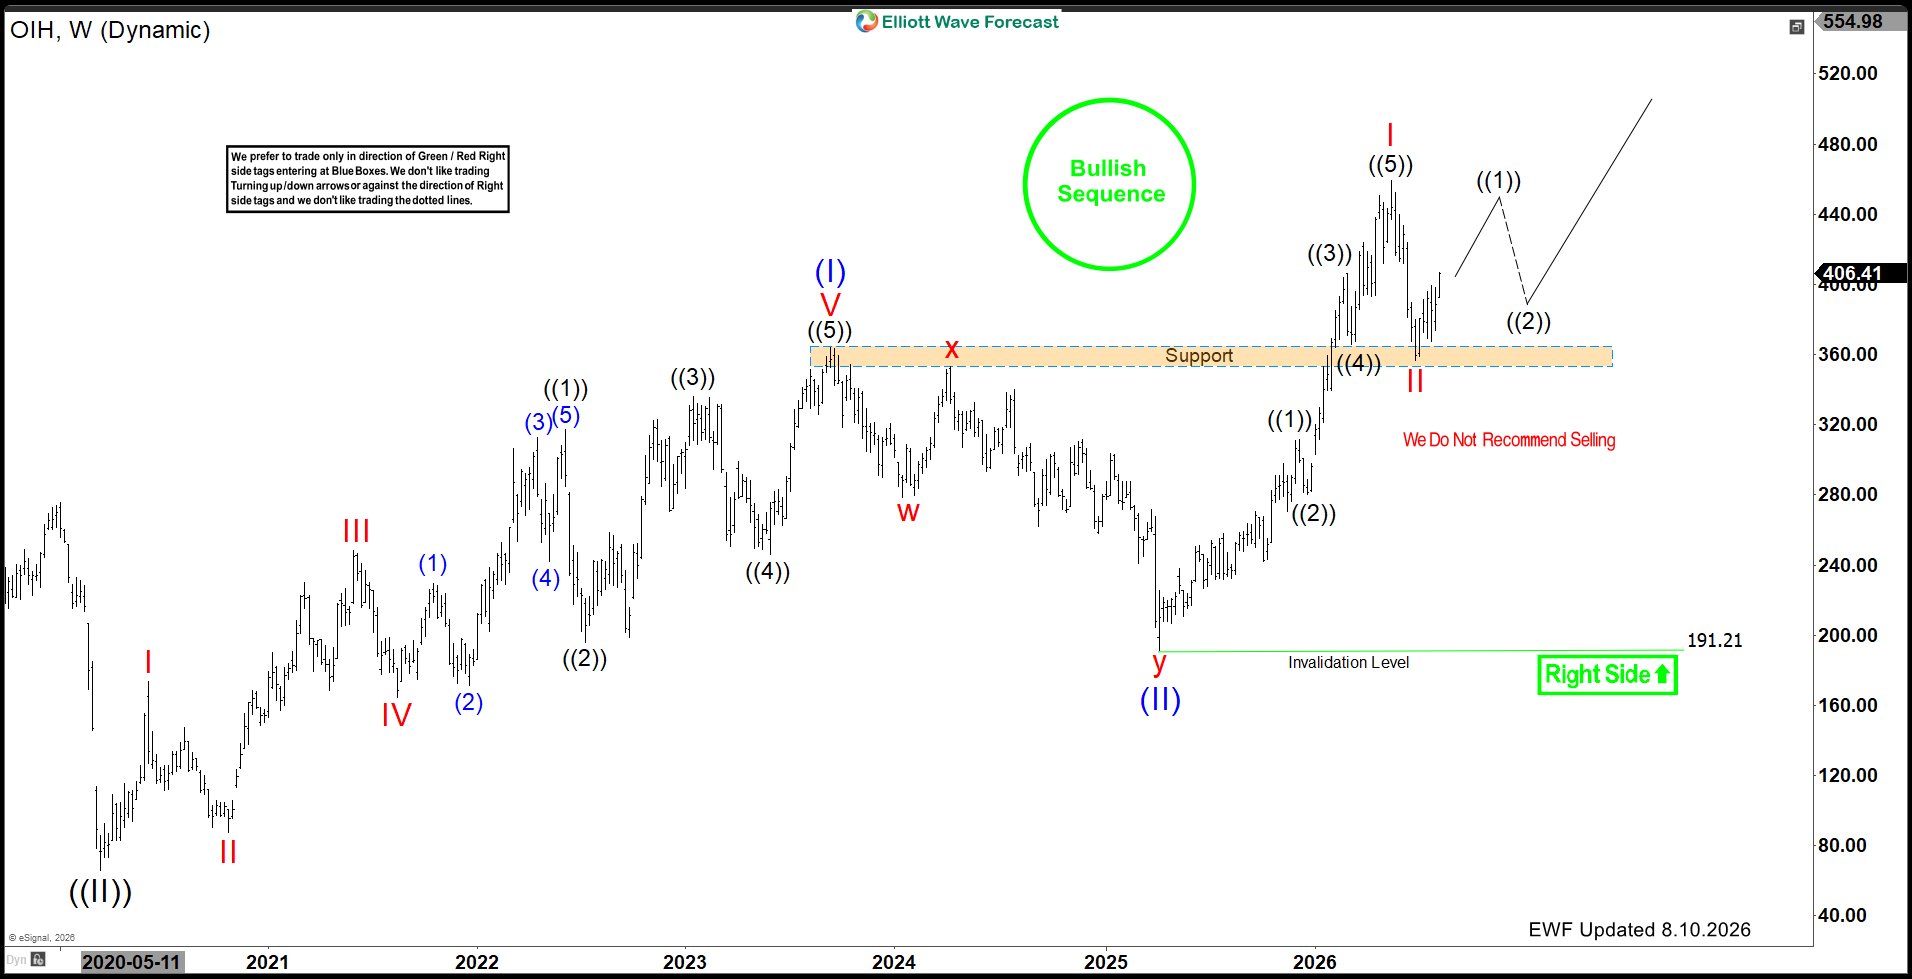 Looking at the weekly chart, $OIH established a major low in 2020 and has since developed a series of bullish impulsive sequences. The structure from that low can be interpreted as a double nest, which represents one of the stronger bullish Elliott Wave formations.
A double nest develops when the market forms multiple wave 1 and wave 2 structures before acceleration begins. Consequently, once those corrective waves finish, the market can enter an extended third-wave phase and produce a much stronger advance.
That larger structure remains visible in $OIH and continues to support the long-term bullish outlook.
Major Correction Ended at the 2025 Low
After completing the previous bullish cycle, $OIH entered a large corrective phase that unfolded into the 2025 low. From there, buyers returned aggressively and started another impulsive advance.
The rally from that low produced a clear five-wave sequence in wave I, pushing $OIH sharply higher. Afterward, the ETF entered another correction in wave II and returned toward an important former resistance area.
Instead of breaking down, however, that previous resistance started acting as support.
Highlighted Support Area Produced the Expected Reaction
The most important development on the chart comes from the highlighted support area around the mid-$350 region. $OIH recently pulled back toward this former breakout zone and attracted buyers.
Since testing that support, the ETF has reacted sharply higher and moved back above the $400 area. This reaction strengthens the view that wave II may already have ended and that a new impulsive sequence could now be underway.
Furthermore, the ability of former resistance to turn into support adds another layer of confirmation to the bullish Elliott Wave structure.
Bullish Sequence Remains Incomplete
The larger sequence from the 2020 lows remains bullish and incomplete. Therefore, the recent reaction from support should not necessarily be viewed as only a short-term bounce.
Instead, the structure allows $OIH to begin another five-wave advance. The first leg higher can complete wave ((1)), followed by a corrective wave ((2)) pullback. Once that correction finishes, another stronger move higher should follow.
As a result, temporary pullbacks should continue to be viewed within the context of the larger bullish sequence rather than as evidence that the long-term advance has ended.
OIH Can Reach $624 Over the Next Few Quarters
As the bullish sequence continues to develop, the larger Elliott Wave structure supports an eventual move toward the $624 area.
This does not mean the ETF will move directly toward that target. Several smaller-degree advances and corrections should take place along the way. However, as long as key support remains intact, those pullbacks should provide opportunities for the bullish trend to reset before extending higher again.
Therefore, the $624 area remains a reasonable upside objective over the next few quarters as the double-nest structure continues to unfold.
Key Support Keeps the Bullish Outlook Intact
For now, the highlighted support zone remains an important reference point. The recent reaction from that area shows that buyers continue to defend the larger bullish sequence.
Meanwhile, the broader Elliott Wave view remains valid above the 191.21 invalidation level. As long as that level remains protected, the long-term right side continues to favor higher prices.
Technical Summary
To summarize, $OIH continues to show a bullish double nest from the 2020 lows, suggesting that the larger upside sequence remains incomplete. More recently, the ETF corrected back toward an important former resistance area and reacted strongly higher from support.
That reaction supports the idea that another impulsive advance is developing. While short-term pullbacks should still occur along the way, the larger bullish sequence can ultimately carry $OIH toward the $624 area over the next few quarters.
As long as key support remains intact, the broader Elliott Wave structure continues to favor buying corrective pullbacks rather than chasing the downside.




