

Hello traders. In this technical article we’re going to take a quick look at the Elliott Wave charts of Google Stock (GOOGL ) published in members area of the website.
As our members know, Googl stock is forming a corrective pattern against the 379.47 peak. In the following analysis, we explain the Elliott Wave pattern and the market outlook.
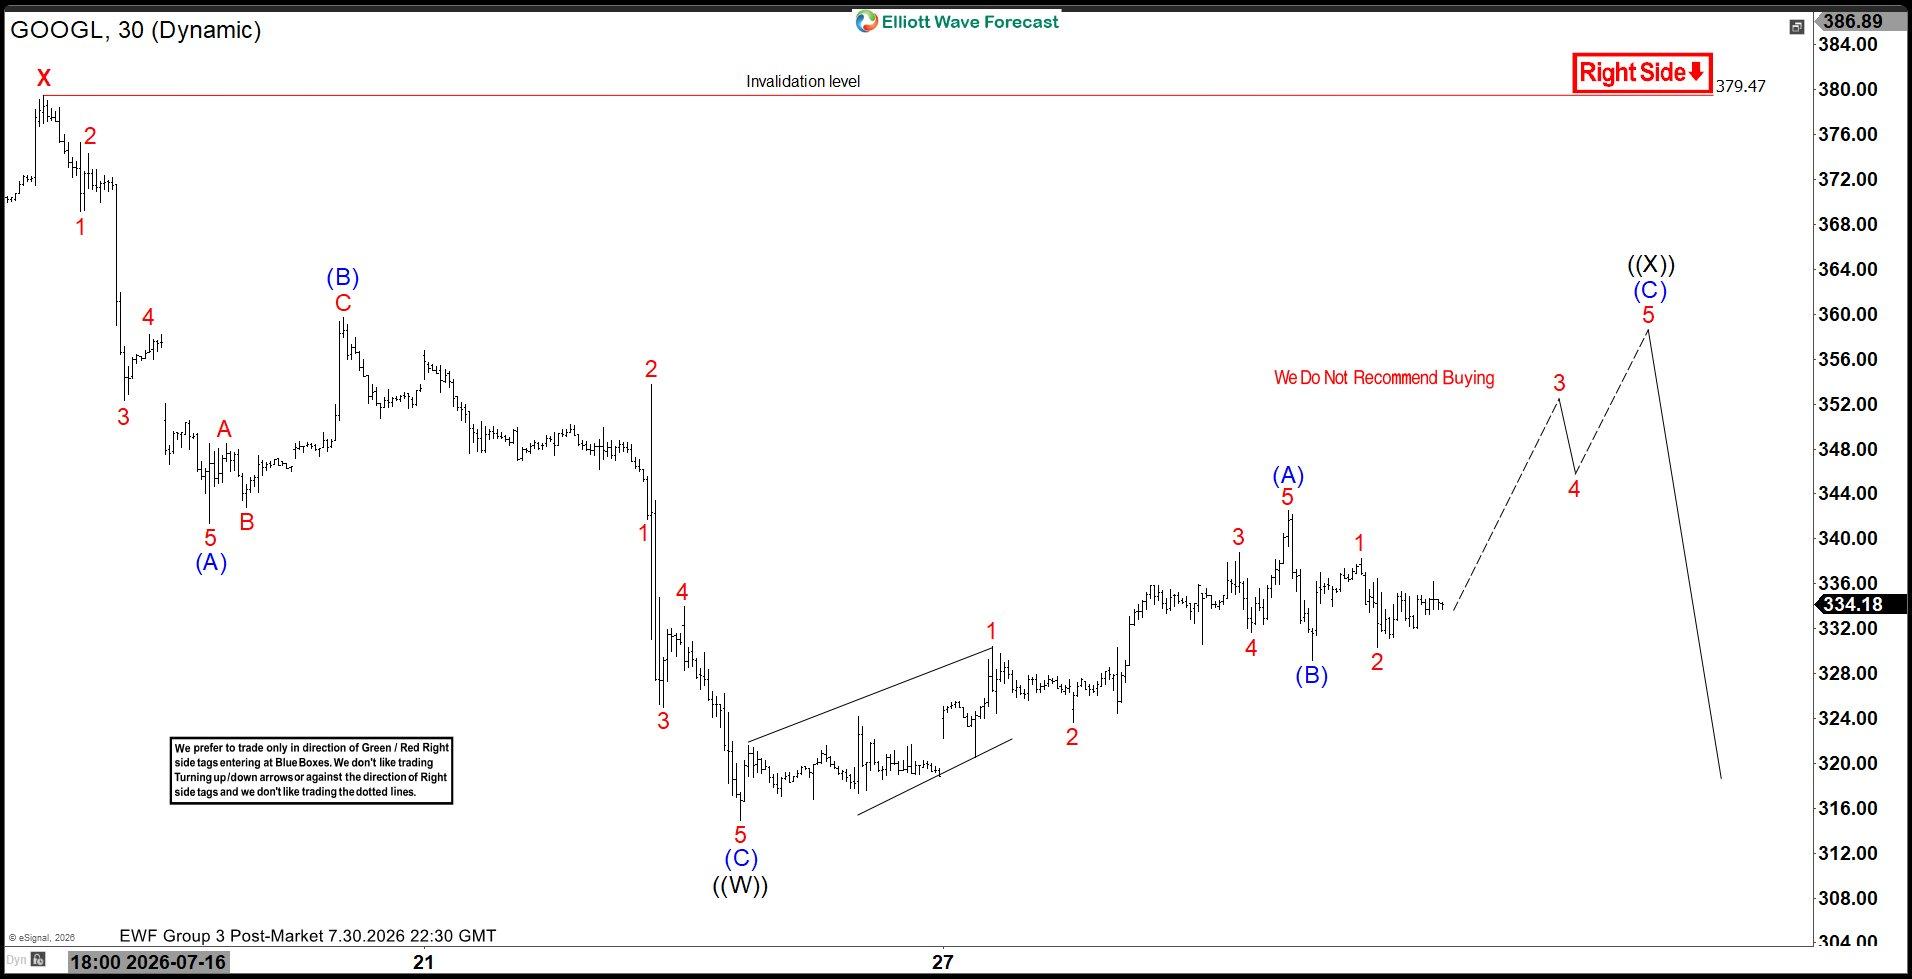
GOOGL Elliott Wave 1 Hour Chart 07.30.2026
Google (GOOGL) is correcting the cycle from the 379.47 peak. So far, we can count a 5-wave structure from the low, suggesting that the first leg higher is complete. At the moment, the pullback structure still appears incomplete. The 5-wave move indicates that the correction is likely forming a Zig Zag pattern (5-3-5). Therefore, we expect another leg higher (C), which should also unfold as a 5-wave structure. Current analysis suggests that wave (B) pullback ended at the 329.42 low. While above this low, wave (C) can be in progress, targeting the 356.86+ zone.
90% of traders fail because they don’t understand market patterns. Are you in the top 10%? Put your skills to the test with this advanced Elliott Wave challenge.
Reminder : Our member chat rooms are open 24/7 and provide ongoing expert guidance on market trends and Elliott Wave analysis. Members are encouraged to ask questions about market structure and technical setups at any time. You can learn more about Elliott Wave Patterns at our Free Elliott Wave Educational Web Page
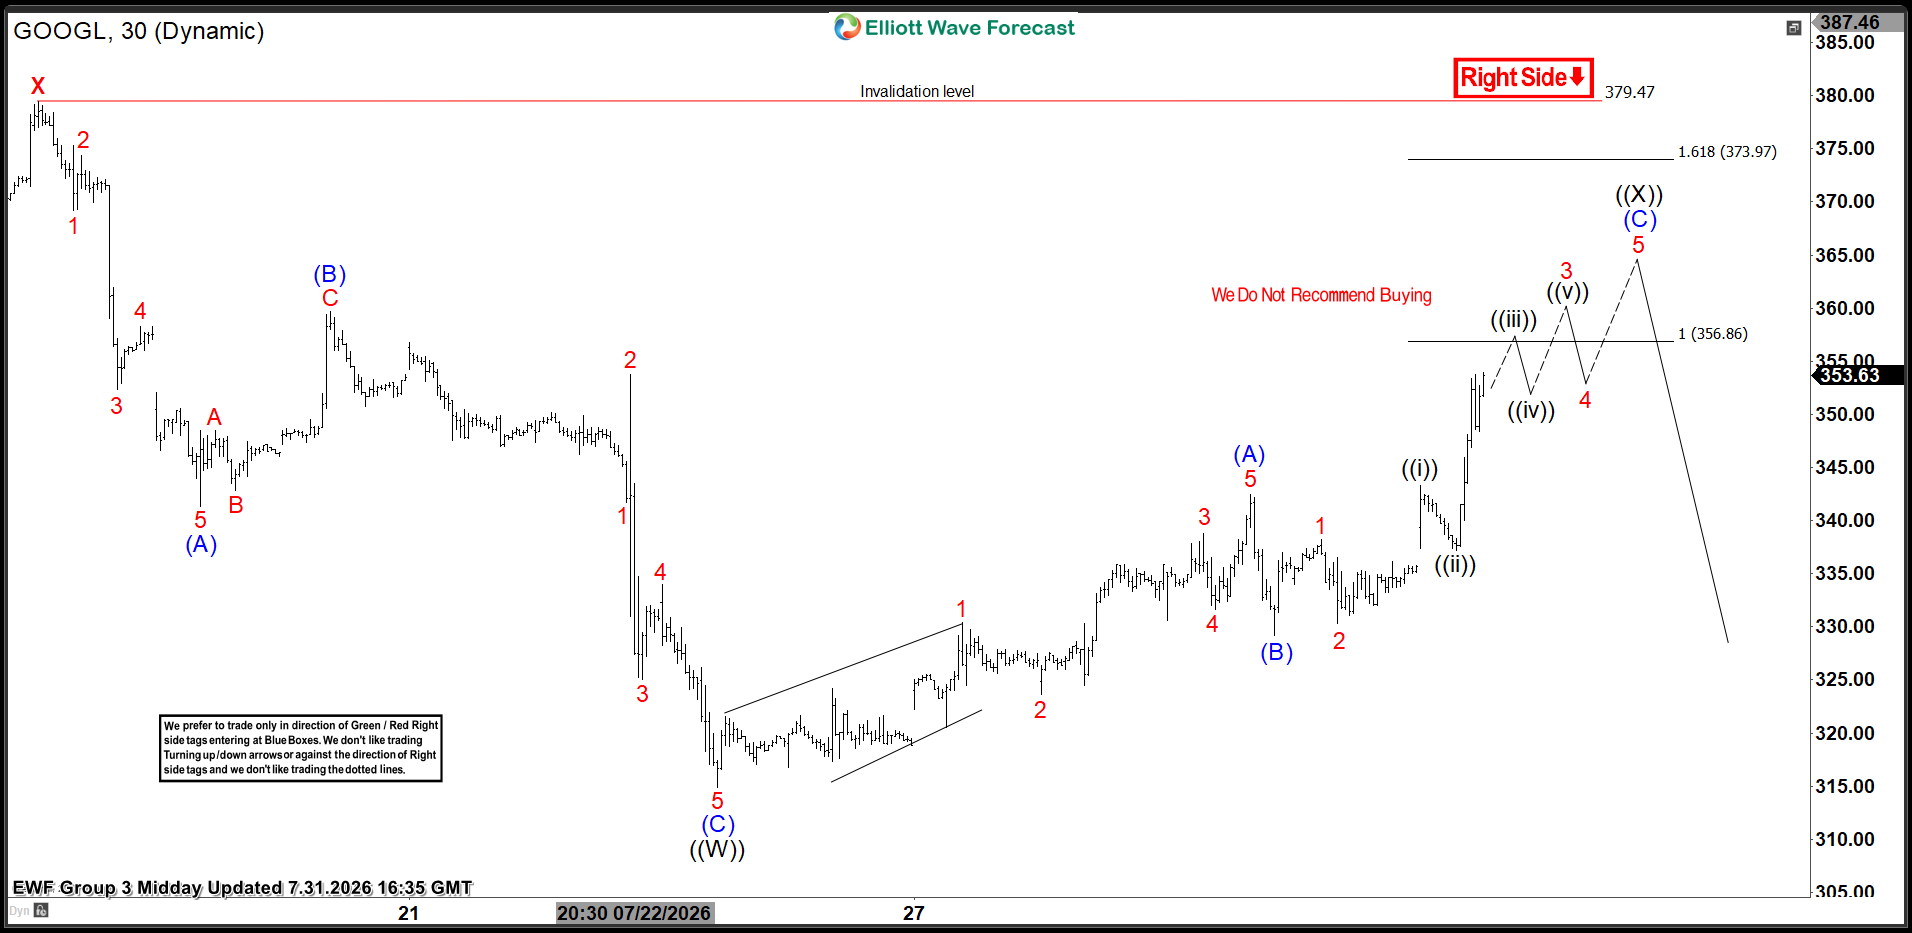
GOOGL Elliott Wave 1 Hour Chart 07.31.2026
The price held above the 329.42 low as expected, and buyers were strong enough to push the price higher. The stock is now approaching our target zone at 356.86–373.97, where we expect sellers to appear again. The key level to watch is 379.47. As long as the pivot at the 379.47 high holds, the preferred view remains intact, and we can see another leg lower once the ((X)) recovery completes.
Keep in mind market is dynamic and presented view could have changed in the mean time. You can check most recent charts in the membership area of the site. Please keep in mind that now every chart is trading recommendation. Best instruments to trade are those having incomplete bullish or bearish swings sequences.We put them in Sequence Report and best among them are shown in the Live Trading Room.
Join us today !
 Elevate your trading with Elliott Wave Forecast!
 Ask unlimited questions during trading hours (Monday to Friday). Our Chat Rooms are an excellent place to learn, with continuous support from our market experts!
 Explore our expert insights and real-time analysis covering Forex, Indices, Commodities, Cryptocurrencies, Stocks, and ETFs across 78 instruments.
 Gain exclusive access to our Official Trading Recommendations in the Live Trading Room, where seasoned experts provide valuable insights and guidance on new trading opportunities.
 For just $0.99, unlock a wealth of knowledge and experience with our 14-day Trial. Experience firsthand our proven trading strategy, which accurately defines Entry, Stop Loss, and Take Profit levels, empowering you to make informed decisions with confidence.
 Ready to take the next step? Get your 14-day Trial in just a few clicks!
Offer Expires Soon!
Get full access to real-time Signals, Live Sessions, 24 Hour Chat Room Support and Expert Analysis — all for only $0.99 during your 14-day trial.
⏳ This limited-time price will expire soon — don’t miss out!




