


Gold has always been one of the most attractive assets for traders and investors. During periods of inflation, geopolitical uncertainty, banking instability, or weakness in the US Dollar, traders often rush toward gold as a safe-haven asset. This continuous flow of fear and greed creates strong price swings that make gold one of the best instruments for technical analysis.
However, gold is also highly volatile. Many traders lose money because they enter too early, trade emotionally, or fail to understand market cycles. This is where Elliott Wave Theory becomes extremely valuable.
Elliott Wave Theory helps traders understand how markets move in repeating cycles driven by human psychology. Instead of reacting emotionally to news headlines, traders can use wave structures, Fibonacci retracements, and trend analysis to identify high-probability trading opportunities in XAUUSD.
In this guide, we explain how to trade gold using Elliott Wave Theory, how to identify wave structures, how Fibonacci levels improve entries, and how professional traders analyze the gold market.
What Is Elliott Wave Theory?
Elliott Wave Theory is a form of technical analysis developed by Ralph Nelson Elliott. The theory states that financial markets move in repetitive patterns because investor psychology continuously shifts between optimism and pessimism.
According to Elliott Wave Theory, markets move in two primary phases: impulsive waves and corrective waves. Impulsive waves move in the direction of the main trend, while corrective waves move against the trend.
A bullish market typically forms a five-wave structure where Waves 1, 3, and 5 move upward, while Waves 2 and 4 act as pullbacks. After the five-wave cycle completes, the market usually enters a three-wave correction known as an ABC correction.
This repetitive structure appears across all financial markets, including stocks, forex, cryptocurrencies, commodities, and especially gold.
Gold responds particularly well to Elliott Wave analysis because its price movements are heavily influenced by fear, uncertainty, inflation expectations, and macroeconomic sentiment. These emotional drivers create clear market cycles that Elliott Wave traders can analyze.
Why Gold Works Well With Elliott Wave Analysis
Gold is not just another financial instrument. Unlike many equities, gold reacts directly to global sentiment, central bank policies, inflation data, and economic uncertainty. Because of this, gold often produces large impulsive trends followed by deep corrective pullbacks.
For example, during periods of rising inflation or geopolitical tension, investors often buy gold aggressively as a hedge against uncertainty. This creates powerful bullish impulsive waves. Once fear slows down or traders begin taking profits, gold enters corrective phases before the next trend begins.
These repeating cycles align naturally with Elliott Wave structures.
Another reason Elliott Wave works well on gold is because gold traders closely watch technical levels. Fibonacci retracement zones, support and resistance areas, and trend structures often become self-fulfilling due to the large number of participants reacting to the same levels.
This creates highly tradable setups for Elliott Wave traders.
Understanding Gold Market Psychology
Before trading gold successfully, it is important to understand what actually drives gold prices.
Gold generally rises when investors become fearful about the economy, inflation, geopolitical conflict, or currency weakness. If traders expect the Federal Reserve to cut interest rates or if the US Dollar weakens, gold often becomes attractive because it preserves value better during uncertainty.
On the other hand, gold stocks can decline when interest rates rise, bond yields increase, or investors shift toward riskier assets such as equities.
Elliott Wave Theory helps traders identify how these emotions are already being reflected in price action before major headlines become obvious to the public.
This is one of the biggest advantages of wave analysis. Instead of reacting late to news, traders can analyze the market structure itself.
How to Identify Elliott Wave Patterns in Gold
The first step in trading gold using Elliott Wave is identifying the larger market trend. Professional traders usually begin their analysis from higher timeframes such as the weekly and daily charts. This helps determine whether gold is currently trending higher, correcting lower, or moving sideways.
Once the primary trend becomes clear, traders begin looking for impulsive wave structures. In bullish conditions, gold often forms strong Wave 3 rallies characterized by momentum acceleration, large bullish candles, and aggressive buying pressure.
Wave 2 and Wave 4 typically act as corrective pullbacks. These corrections often retrace into Fibonacci support levels before the trend resumes higher.
For example, if gold rallies strongly from 2200 to 2400, traders may anticipate a corrective pullback into the 38.2%, 50%, or 61.8% Fibonacci retracement levels before the next bullish wave begins.
Corrective structures usually appear as ABC patterns, zigzags, flats, or triangles. Understanding these Elliott wave patterns allows traders to distinguish between temporary pullbacks and full trend reversals.
Using Fibonacci Levels in Gold Trading
Fibonacci retracement is one of the most important tools in Elliott Wave analysis. Since markets rarely move in straight lines, Fibonacci levels help traders identify potential reversal areas during pullbacks.
The most important Fibonacci retracement levels for gold trading include 38.2%, 50%, and 61.8%.
Gold frequently reacts strongly around these zones because institutional traders and algorithms also monitor them closely.
Suppose gold rallies from 2100 to 2400. Instead of chasing the price higher emotionally, an Elliott Wave trader waits for a corrective pullback into a Fibonacci support zone. If price begins stabilizing near the 50% or 61.8% retracement while momentum indicators show bullish divergence, traders may interpret this as a potential Wave 2 completion.
This structured approach improves timing and risk management significantly.
Fibonacci extensions are also useful for projecting profit targets. Wave 3 often extends toward the 1.618 Fibonacci extension, making it one of the most profitable phases for traders.
Best Timeframes for Trading Gold
Different timeframes serve different purposes in Elliott Wave analysis.
The weekly chart helps traders identify the long-term trend and major market cycles. The daily chart is ideal for swing trading and identifying major wave structures. Meanwhile, the 4-hour chart helps traders refine setups and improve trade timing.
For intraday traders, the 1-hour chart is commonly used to identify precise entries and stop-loss placements.
Most professional traders combine multiple timeframes together. They may identify the overall trend on the daily chart while executing entries on the 1-hour or 4-hour chart.
This multi-timeframe approach improves accuracy and prevents traders from trading against the dominant trend.
How to Trade XAUUSD Using Elliott Wave
A structured gold trading process usually begins with identifying the larger market direction. Traders first determine whether the higher timeframe trend is bullish or bearish.
Next, they analyze the wave count. If gold appears to be completing a corrective ABC structure near Fibonacci support, traders begin looking for confirmation signals.
Confirmation may include bullish engulfing candles, RSI divergence, trendline breaks, or increasing buying momentum.
Once confirmation appears, traders enter the trade while placing a stop-loss below the wave invalidation level.
Profit targets are then projected using Fibonacci extensions or previous highs.
This process removes emotional decision-making and replaces it with structured analysis.
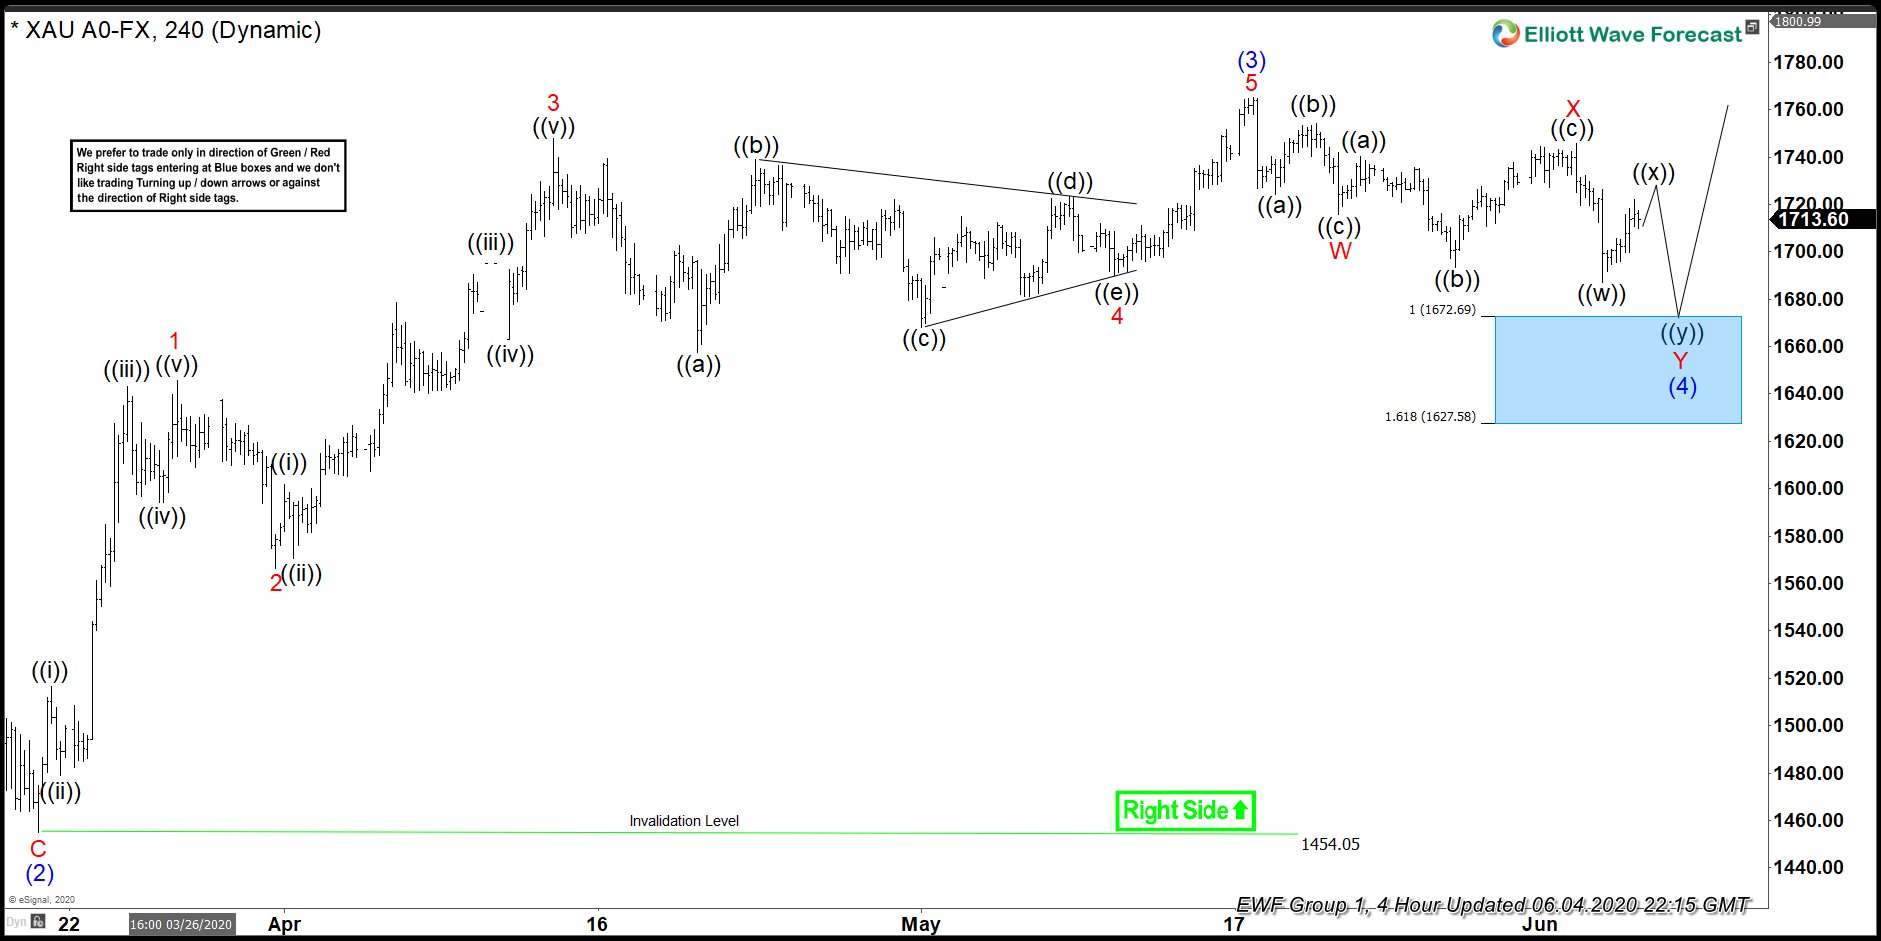
Gold [4 June 2020]
Showed 5 swings incomplete sequence from the peak of wave (3). We expected another swing lower to reach the blue box before buyers entered the market again
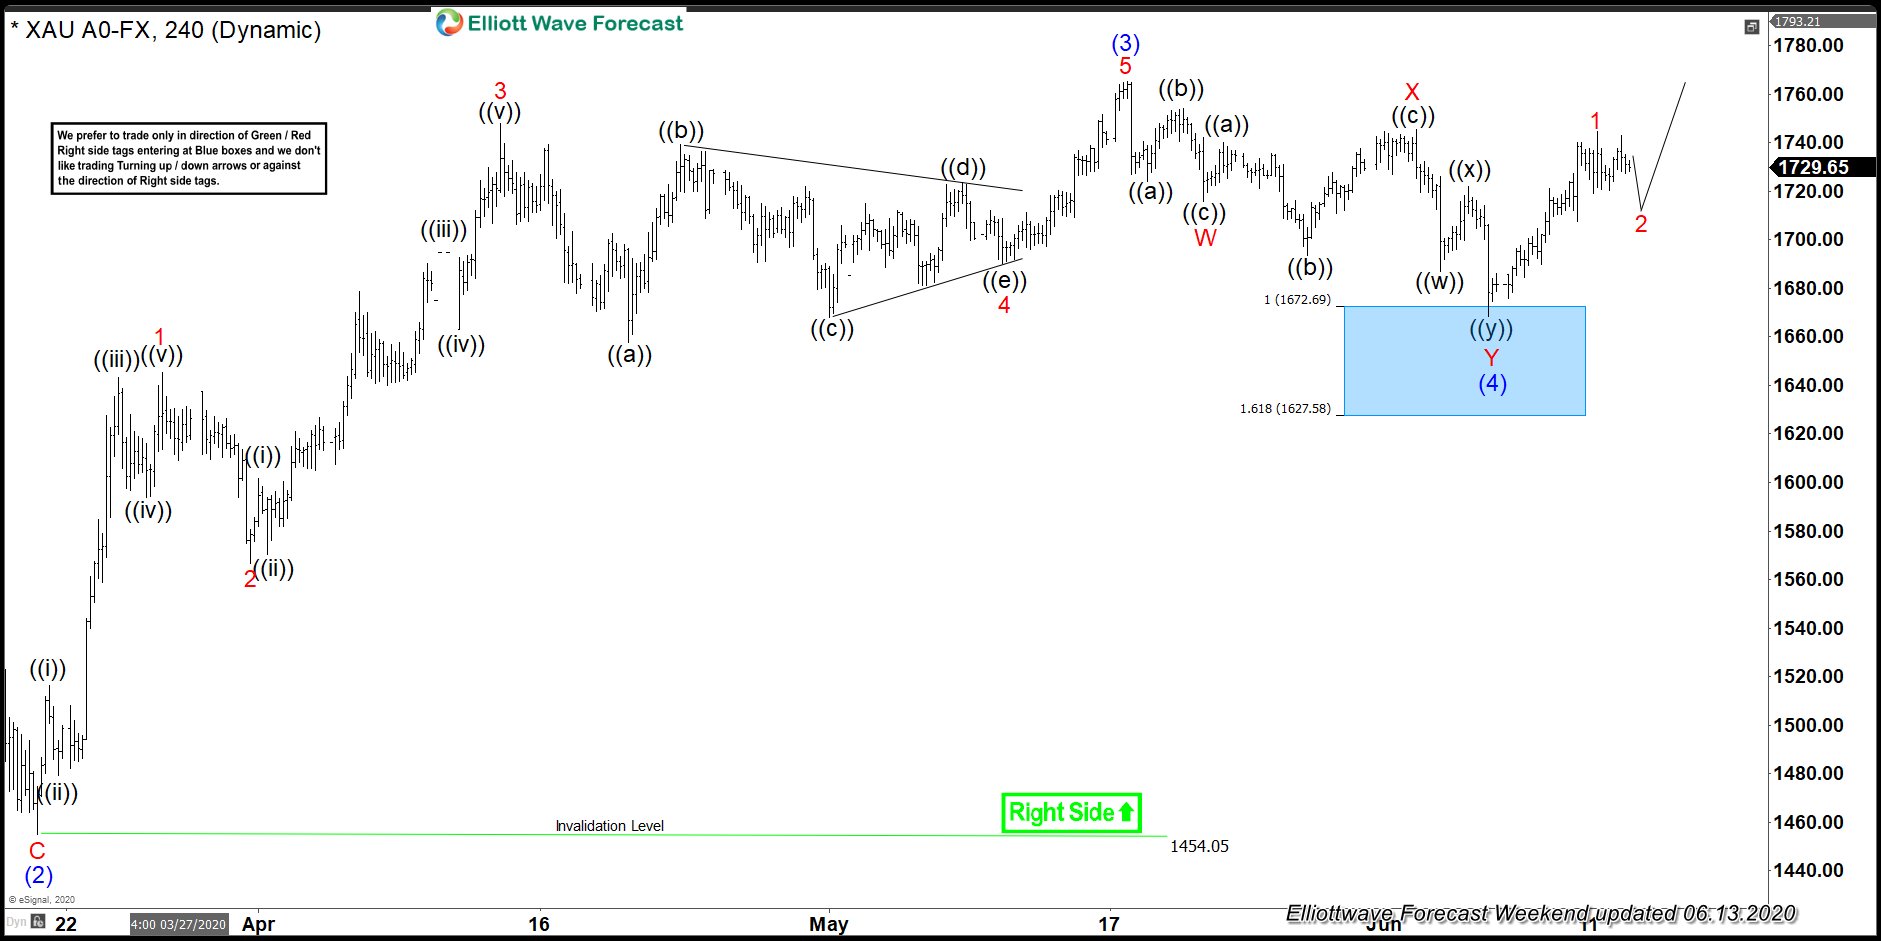
Gold [13 June 2020]
Gold found buyers in the blue box and rallied over $70 in the next few trading days allowing any traders who bought it in the blue box to move stop to entry level.
At Elliott Wave Forecast, we provide daily XAUUSD analysis, professional Elliott Wave forecasts, and multi-timeframe market coverage across 78+ instruments.
Start your 14-Day Trial today for just $0.99 and gain access to:
- Daily gold forecasts
- Elliott Wave trade setups
- Fibonacci analysis
- Live market updates
- Professional trading education
Risk Management in Gold Trading
Gold is extremely volatile, which means risk management is critical.
Many traders fail because they overleverage positions or ignore stop-loss placement. Even the best Elliott Wave setup can fail under unexpected market conditions.
Professional traders usually risk only 1% to 2% of their account per trade. They also avoid emotional trading during major events such as FOMC meetings, inflation reports, or geopolitical headlines.
Stop losses should always be based on technical invalidation levels rather than random price distances.
A good trade setup is not just about potential profit. It is also about controlling downside risk.
Common Mistakes Traders Make
One of the biggest mistakes traders make is forcing wave counts onto unclear structures. Elliott Wave analysis requires flexibility. Markets do not always form perfect textbook patterns.
Another common mistake is ignoring higher timeframe direction. Traders often become too focused on short-term charts and accidentally trade against the larger trend.
Entering too early is another major issue. Many traders try predicting reversals before confirmation appears. Waiting for structure confirmation greatly improves accuracy.
Finally, poor risk management destroys many trading accounts. Even accurate analysis becomes useless without proper capital protection.
Combining Elliott Wave With Other Indicators
Although Elliott Wave Theory is powerful on its own, combining it with confirmation tools improves trading performance significantly.
The Relative Strength Index (RSI) helps traders identify momentum divergence and overbought or oversold conditions. MACD can help confirm trend acceleration and momentum shifts.
Support and resistance analysis also strengthens wave counts because gold often reacts strongly around key technical levels.
Volume analysis can further confirm impulsive wave structures. Strong bullish waves usually appear with rising momentum and increasing participation.
Combining these tools creates higher-confidence trading setups.
Final Thoughts
Gold remains one of the best markets for Elliott Wave traders because it consistently reflects human emotion, macroeconomic sentiment, and institutional positioning.
By understanding impulsive waves, corrective structures, Fibonacci retracements, and market psychology, traders can approach XAUUSD with far more confidence and structure.
Instead of reacting emotionally to headlines, Elliott Wave traders focus on market cycles and probability-based setups.


