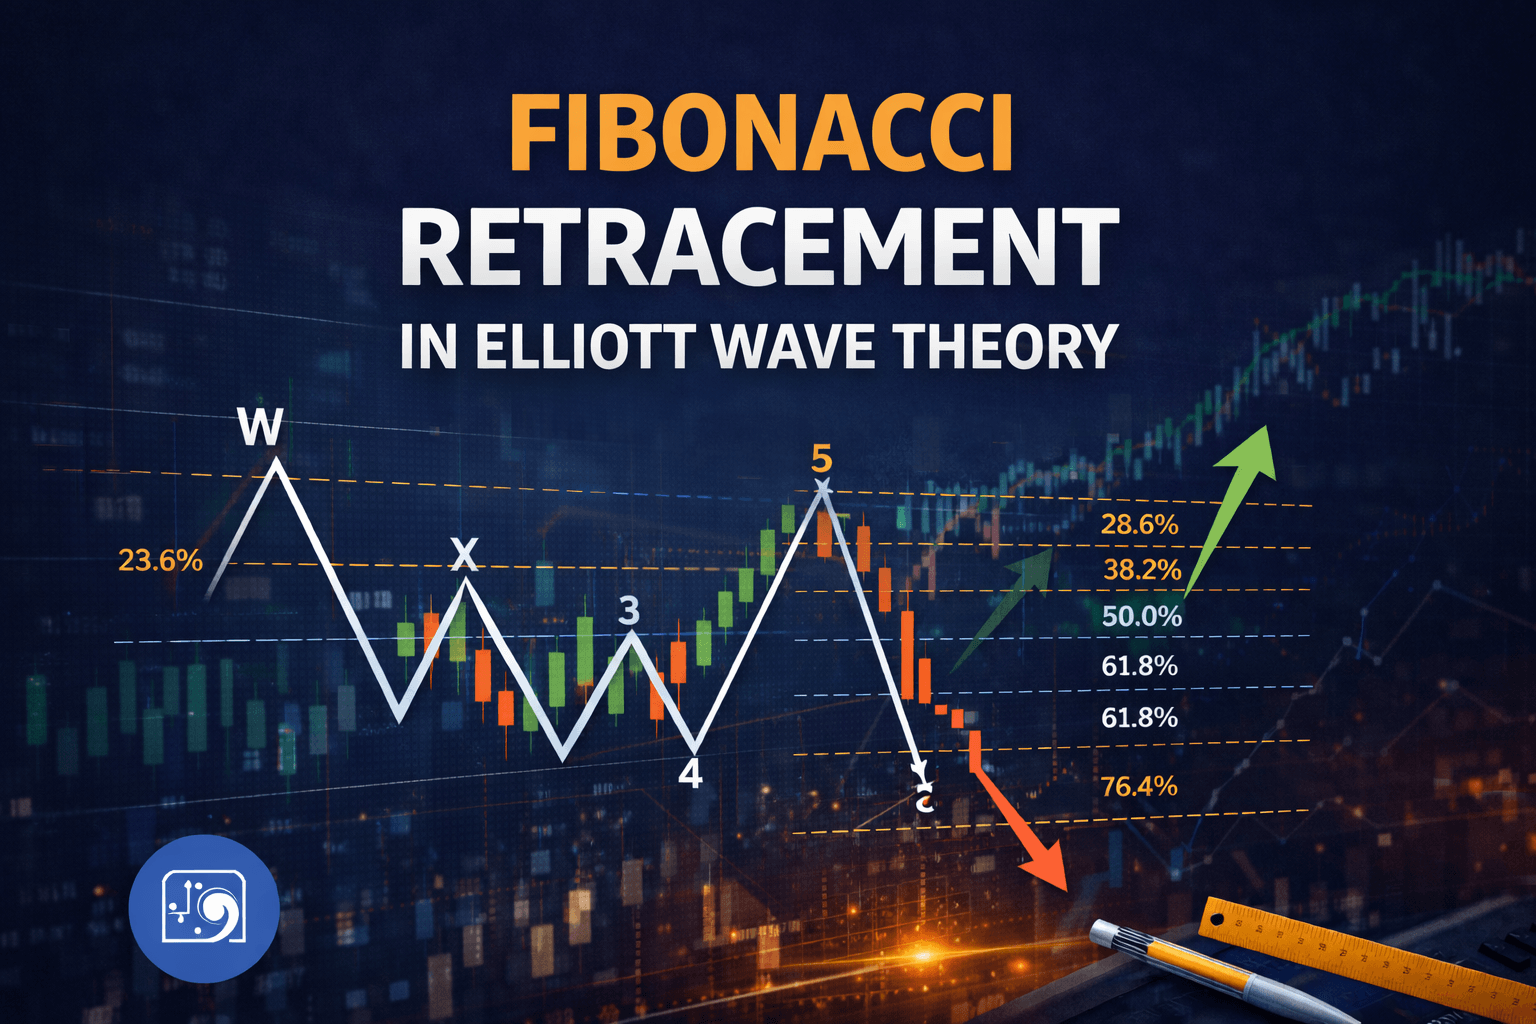
Fibonacci ratios are essential tools in technical analysis, widely used to forecast market movements and identify key support and resistance levels. When combined with Elliott Wave Theory, Fibonacci retracements provide a powerful framework for analyzing price structure and predicting future trends.
This guide explains how Fibonacci ratios work within Elliott Wave structures and how traders can use them to improve decision-making.
One of the most effective ways to identify the end of a correction—and potential reversal zones—is by using Fibonacci retracement levels as part of your analysis.
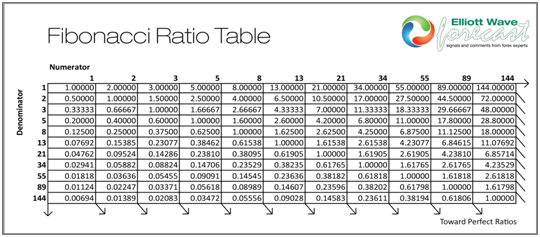
Fibonacci retracement is widely used among Elliott Wave traders and is based on the mathematical principles discovered by Leonardo Fibonacci. The key Fibonacci levels include 23.6%, 38.2%, 50%, 61.8%, 76.4%, and 100%.
Determining the correct retracement area depends on several factors, including the previous wave structure and overall market conditions.
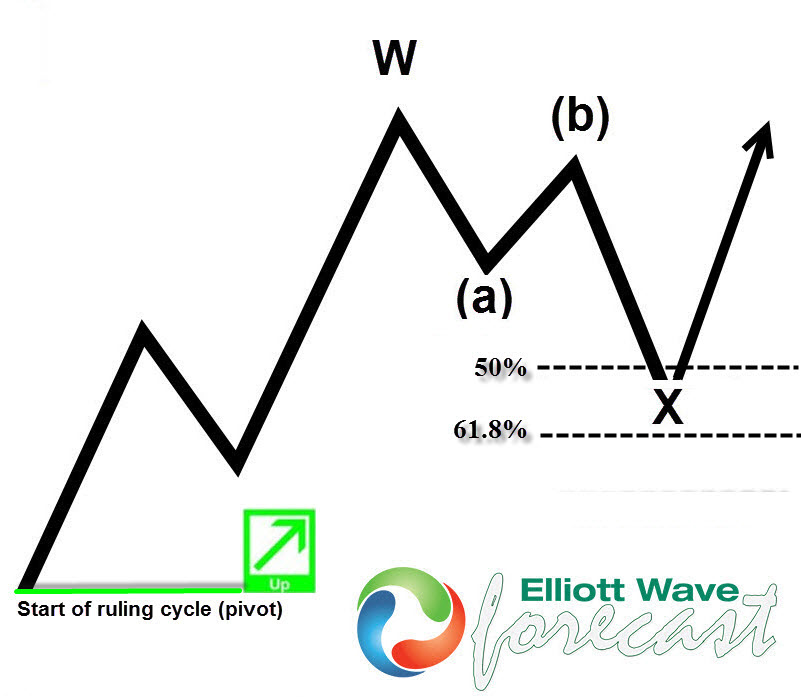 In most cases, standard corrections tend to complete within the 50%–61.8% Fibonacci retracement zone. This commonly occurs in:
- Wave 2 within a 5-wave impulsive structure
- Wave X in double or triple combinations
- Wave B in a zigzag correction
Understanding these relationships helps traders anticipate where corrections may end and where the next trend move could begin.
What Are Fibonacci Ratios?
Fibonacci retracement levels are derived from the Fibonacci sequence and are used to measure potential pullbacks in price.
Key Fibonacci Levels:
- 23.6%
- 38.2%
- 50%
- 61.8%
- 76.4%
- 100%
 To apply Fibonacci retracement:
- Identify the high and low points on a chart
- Plot retracement levels between 0% and 100%
- Use these levels to find support and resistance zones
These levels help traders anticipate where price corrections may end and trends may resume.
Why Fibonacci Matters in Elliott Wave Theory
Fibonacci ratios play a crucial role in measuring wave relationships within an Elliott Wave structure.
Each wave tends to follow specific Fibonacci proportions, allowing traders to:
- Forecast wave targets
- Identify retracement zones
- Confirm wave counts
- Improve entry and exit timing
Always combine Fibonacci with other technical indicators.

Fibonacci Guidelines in Impulse Waves
In impulsive structures, Fibonacci relationships help define wave behavior:
- Wave 2 typically retraces 23.6% – 61.8% of Wave 1
- Wave 3 is often the strongest and may extend significantly
- Wave 4 usually retraces 23.6% – 38.2% of Wave 3
- Wave 5 may extend to 161.8% of Waves 1–3
Key Insights:
- If Wave 3 is extended → Waves 1 and 5 tend to be equal
- Deep Wave 2 retracements may invalidate the wave count
- Wave 4 should not retrace more than 50% of Wave 3
These rules apply within the classic 5-wave structure of Elliott Wave.
Fibonacci in Zigzag Corrections
Zigzag patterns follow clear Fibonacci relationships:
- Wave B retraces 38% – 79% of Wave A
- Wave C often equals Wave A (100%)
- Extensions:
- 61.8%
- 161.8%
👉 Zigzags are sharp corrections and often signal strong trend continuation.
Fibonacci in Flat Corrections
Flat corrections behave differently:
- Wave B retraces deeply (often close to 100%)
- Wave C extends 100% – 161.8% of Wave A
- In rare cases, Wave C can reach 261.8%
Fibonacci in Triangle Patterns
Triangle corrections follow consistent ratios:
- Waves typically relate at 61.8% – 78.6%
- Expanding triangles: each wave can extend 161.8%
- Running triangles show shallow retracements
Fibonacci in Complex Corrections
In double and triple combinations:
- Waves retrace 78% – 138% of each other
- Price action becomes sideways and overlapping
- Markets often enter consolidation phases
These are commonly seen in double and triple combinations.
Real Trading Application
Fibonacci retracement is widely used by Elliott Wave traders to identify high-probability setups.
Common Scenarios:
- Wave 2 → 50%–61.8% retracement
- Wave 4 → 23.6%–38.2% retracement
- Wave B / X → 50%–61.8%
- Strong trends → shallow pullbacks (23.6%–38.2%)
- Deep corrections → 76.4% or higher
Get access to real-time Elliott Wave forecasts and trade setups with our subscription plans.
Important Trading Considerations
- Fibonacci should not be used alone
- Always combine with:
- RSI
- MACD
- Candlestick patterns
- Confirm signals with wave structure and market context
Conclusion
Fibonacci retracement is a powerful tool when combined with Elliott Wave Theory. It helps traders:
- Identify key turning points
- Improve trade accuracy
- Understand market structure
However, no method is foolproof. Successful trading requires combining Fibonacci analysis with other technical tools and proper risk management.
FAQs
1. What is Fibonacci retracement?
A tool used to identify support and resistance levels based on key ratios like 38.2%, 50%, and 61.8%.
2. How does Fibonacci work in Elliott Wave?
It measures wave relationships and helps identify retracements and price targets.
3. What are the key Fibonacci levels?
23.6%, 38.2%, 50%, 61.8%, and 76.4%.
4. Which Fibonacci level is best for entry?
The 50%–61.8% zone is most commonly used for trade entries.
5. Is Fibonacci retracement accurate?
It’s effective when combined with Elliott Wave and other indicators.
6. Can Fibonacci be used alone?
Yes, but it works better with Elliott Wave and technical analysis.
7. How is Fibonacci used in impulse waves?
It helps define retracements (Wave 2, 4) and extensions (Wave 3, 5).
8. How does Fibonacci apply to corrections?
It measures relationships in zigzags, flats, and triangles.
9. What’s the difference between retracement and extension?
Retracement measures pullbacks; extension projects future moves.
10. Why do traders use Fibonacci?
To find entry points, targets, and support/resistance levels.
11. Does Fibonacci work in all markets?
Yes, it works in forex, stocks, crypto, and commodities.
12. What are common mistakes with Fibonacci?
Using it alone, drawing incorrectly, or ignoring market structure.


