Hello fellow traders. In this technical article, we take a quick look at the Elliott Wave charts of the Gold Miners ETF (GDX), published in the members’ area of our website. The ETF shows bullish impulsive sequences on both the daily and weekly charts. The structure points to a strong uptrend, with higher highs and higher lows. Pullbacks should find support in key areas, offering buying opportunities.
In the following sections, we explain the Elliott Wave structure, highlight key levels, and outline possible scenario. We focus on trading with the trend and avoid selling while the bullish sequence remains intact.
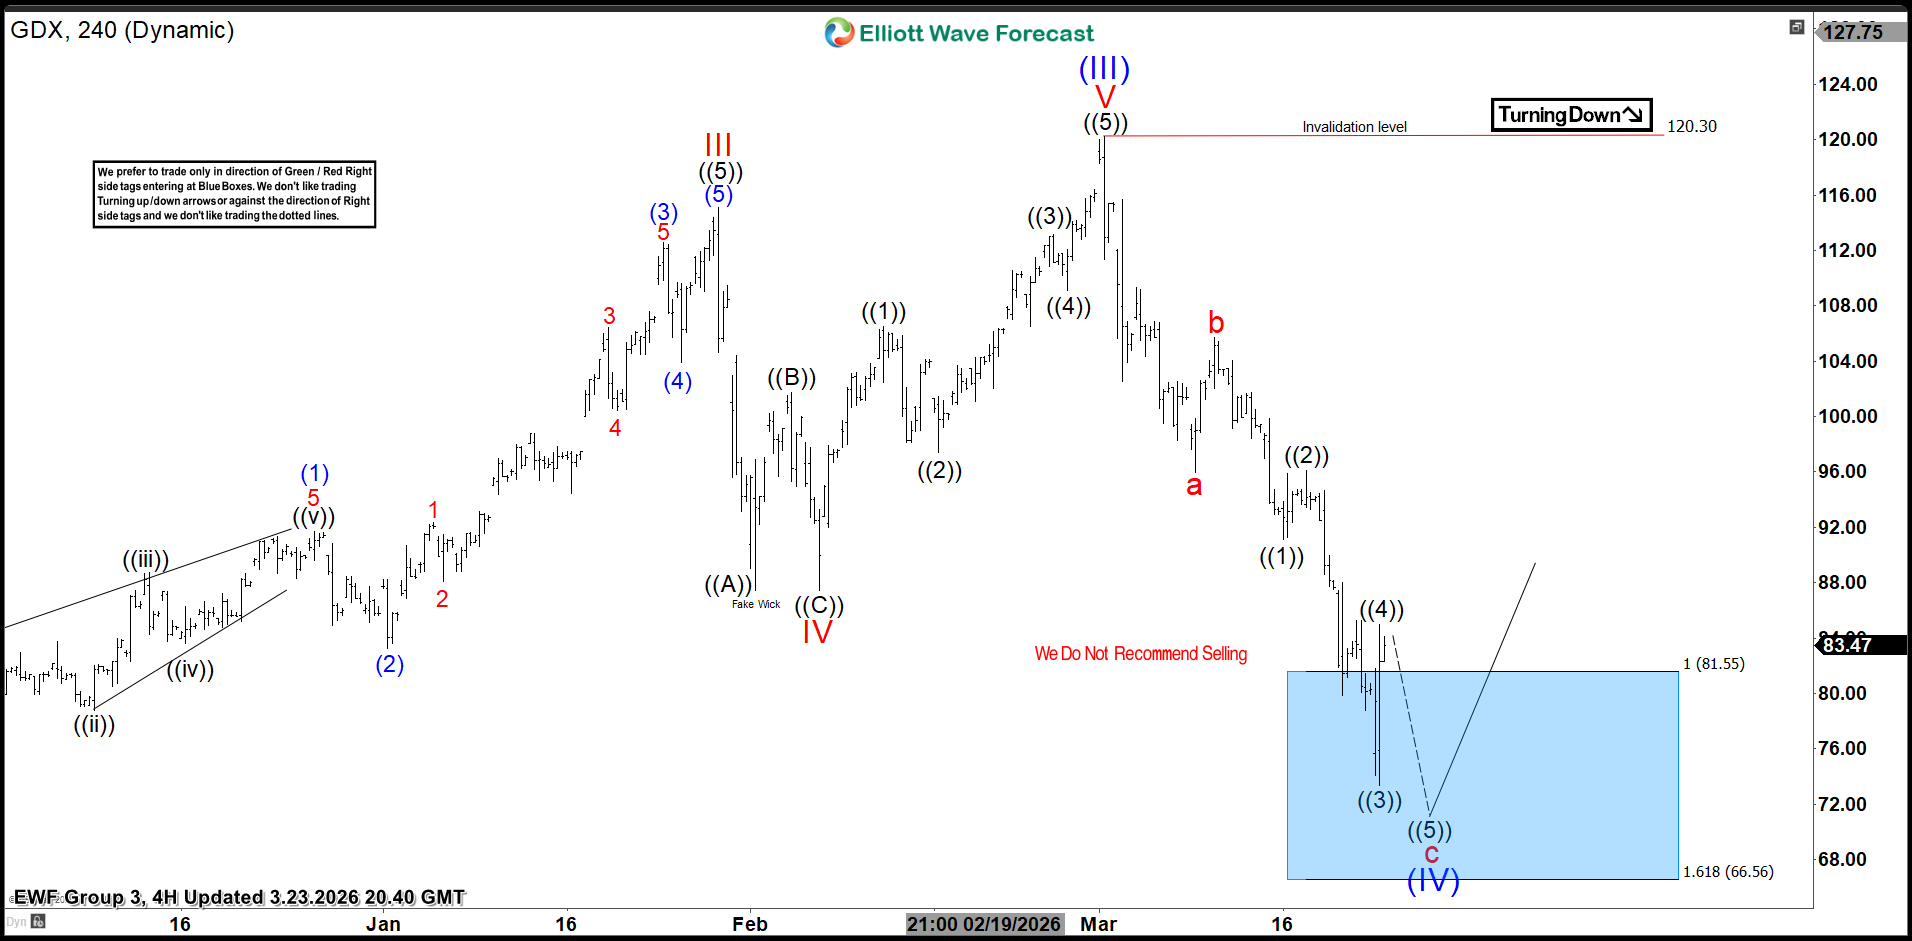
GDX Elliott Wave 4 Hour Chart 3.23.2026
Current analysis suggests GDX is close to completing wave (IV) (blue) as an ABC zigzag. The extreme zone has already been reached at 81.55–66.56, marked as the blue box. As long as price stays above the 66.56 low, the bullish count remains valid. We expect further strength in the ETF. A rally from the buyers’ zone could lead to new highs. We advise against selling.
Official trading strategy on How to trade 3, 7, or 11 swing and equal leg is explained in details in Educational Video, available for members viewing inside the membership area.
90% of traders fail because they don’t understand market patterns. Are you in the top 10%? Test yourself with this advanced Elliott Wave Test
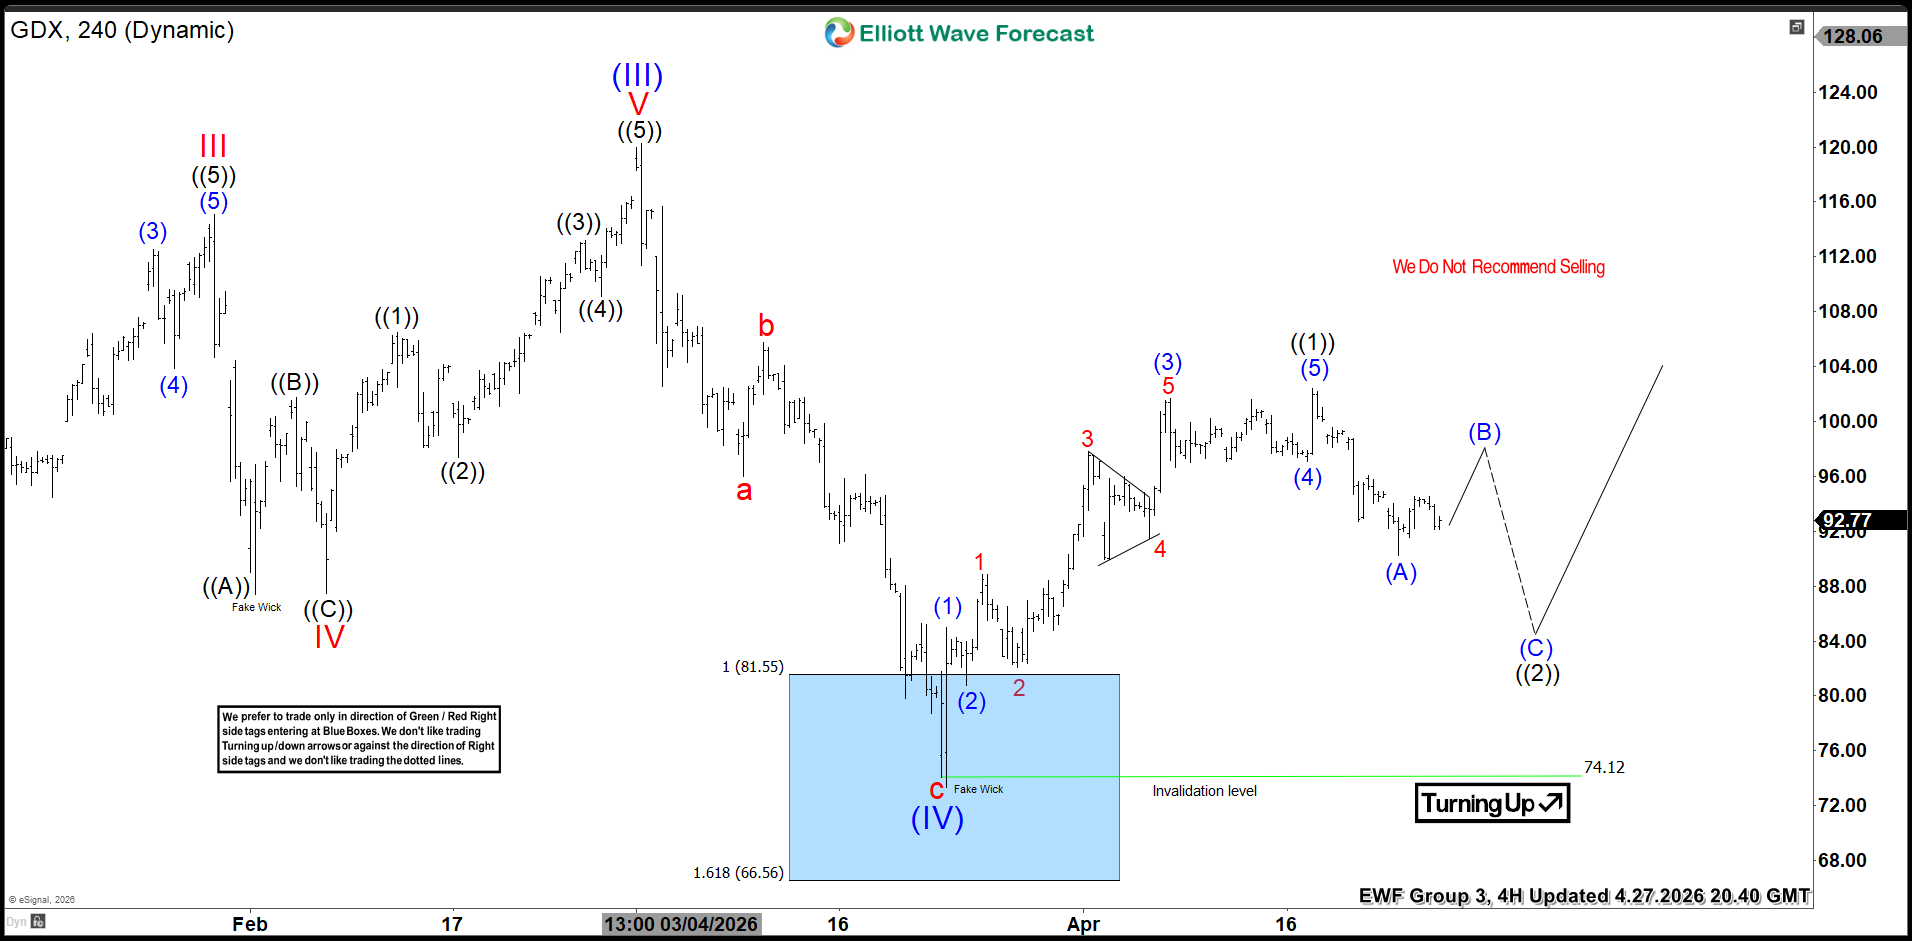
GDX Elliott Wave 4 Hour Chart 04.27.2026
GDX ETF held above 66.56 and extended higher, as expected. The correction ended at 74.12, which now acts as the key level. From that low, GDX completed a 5-wave advance labeled ((1)) in black. A 3-wave pullback toward 81.56–77.48 is expected. After wave ((2)) completes, we can define the next upside target.
Keep in mind, the market is dynamic. The presented view could change over time. You can check the latest charts and target levels in the membership area of the site. The best instruments to trade are those with incomplete bullish or bearish swings. These are listed in the Sequence Report, and the best ones are shown in the Live Trading Room.
Thank you for exploring our GDX technical article with us. While we analyze 78 instruments, it’s important to remember that not every chart represents a trading recommendation. For official trading signals, we invite you to join our Live Trading Room, where we provide actionable insights in real-time. If you’re not yet a member, take advantage of our 14-day trial to unlock new trading opportunities.
Over the years, we’ve developed a reliable trading strategy that clearly defines entry, stop loss, and take profit levels. By joining us, you’ll gain access to expert guidance and the chance to refine your trading skills
Join us today !
 Elevate your trading with Elliott Wave Forecast!
 Ask unlimited questions during trading hours (Monday to Friday). Our Chat Rooms are an excellent place to learn, with continuous support from our market experts!
 Explore our expert insights and real-time analysis covering Forex, Indices, Commodities, Cryptocurrencies, Stocks, and ETFs across 78 instruments.
 Gain exclusive access to our Official Trading Recommendations in the Live Trading Room, where seasoned experts provide valuable insights and guidance on new trading opportunities.
 For just $0.99, unlock a wealth of knowledge and experience with our 14-day Trial. Experience firsthand our proven trading strategy, which accurately defines Entry, Stop Loss, and Take Profit levels, empowering you to make informed decisions with confidence.
 Ready to take the next step? Get your 14-day Trial in just a few clicks!
Offer Expires Soon!
Get full access to real-time Signals, Live Sessions, 24 Hour Chat Room Support and Expert Analysis — all for only $0.99 during your 14-day trial.
⏳ This limited-time price will expire soon — don’t miss out!


