

Walmart (NYSE: WMT) ended its rally from the April 2025 low triggering a larger degree correction. We mentioned this idea earlier this year in our previous article. Today, we explain the Elliott Wave structure unfolding now. Our analysis leads to the next potential investment opportunity.
Elliott Wave Analysis
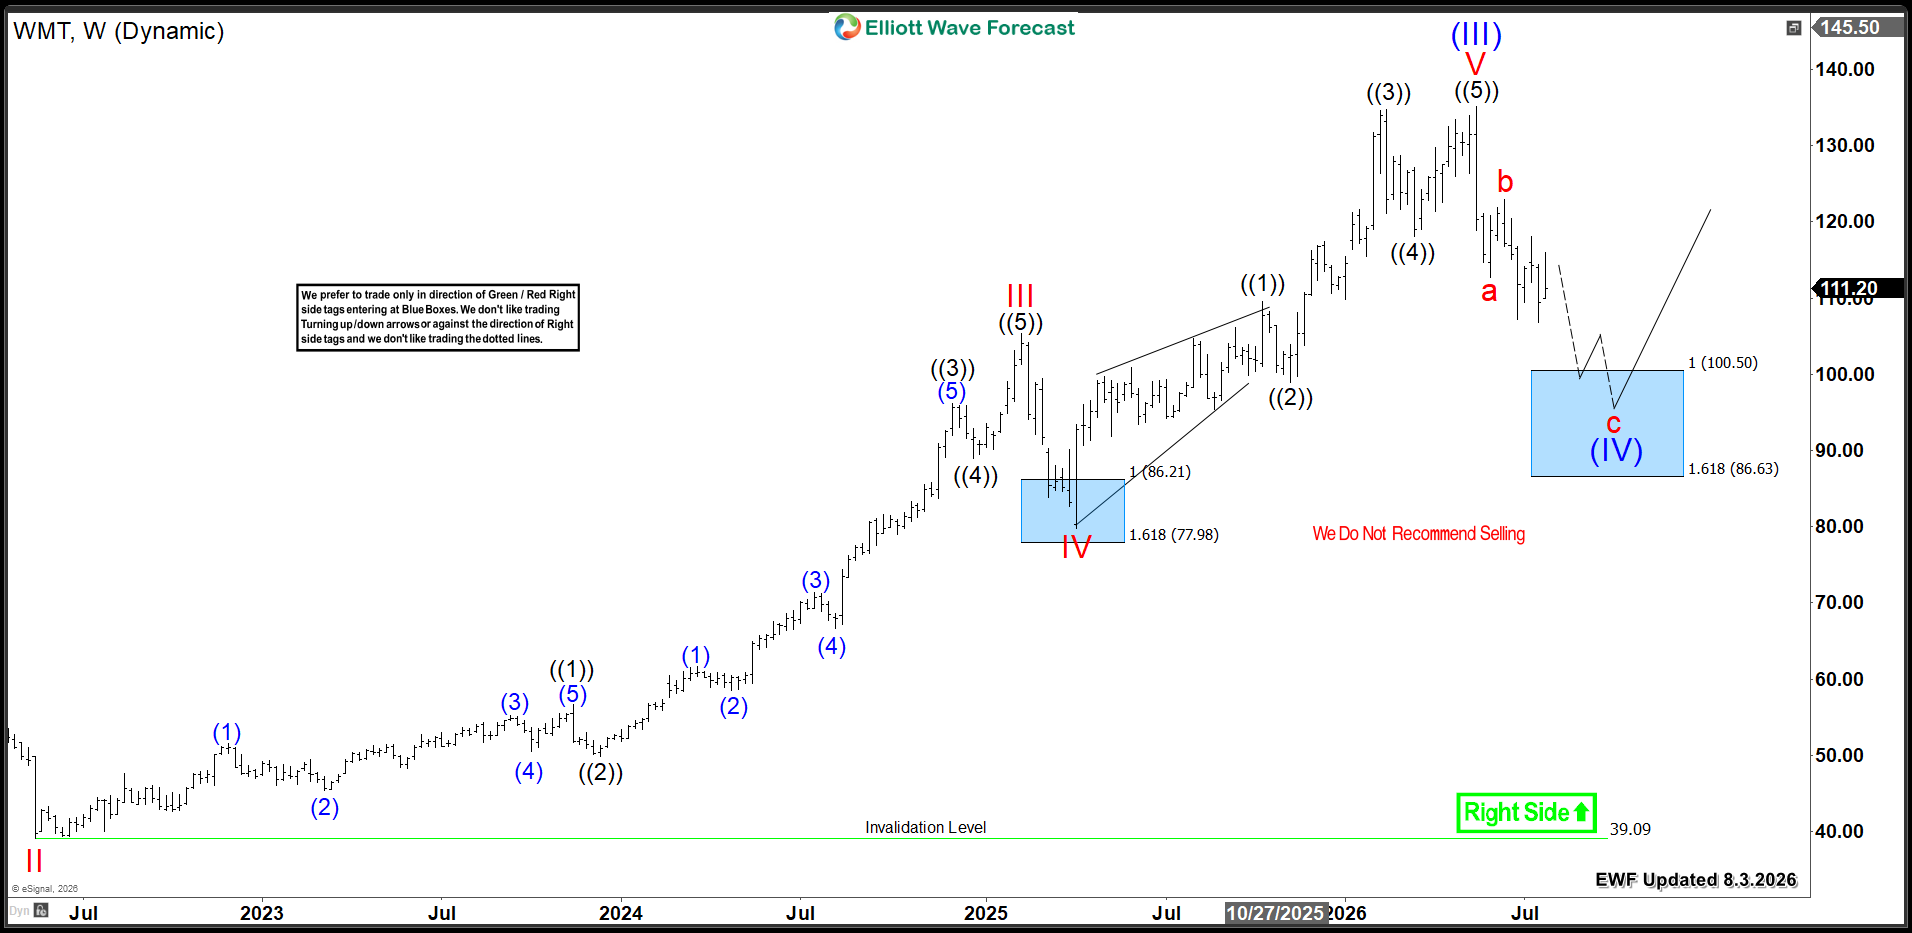
Conclusion
Walmart (WMT) weekly bullish cycle remains firmly intact. Therefore, this correction will create the next strategic buying opportunity before the uptrend resumes.
Get More Insights Today
Learn to trade our Blue Boxes using the 3, 7, or 11 swings sequence. Try our services with a 14-day trial.
You will gain access to:
-
78 instruments updated across 4 different time frames
-
Live Trading & Analysis Sessions with our Expert Analysts every day
-
24-hour chat room support and much more
Explore our system to gain deeper insights into this methodology.



