

In our previous Elliott Wave update on the VanEck Oil Services ETF ($OIH), we highlighted the bullish double nest from the 2020 lows and the strong reaction higher from the major support area. That advance has continued to develop as expected and now appears to have completed wave ((1)).
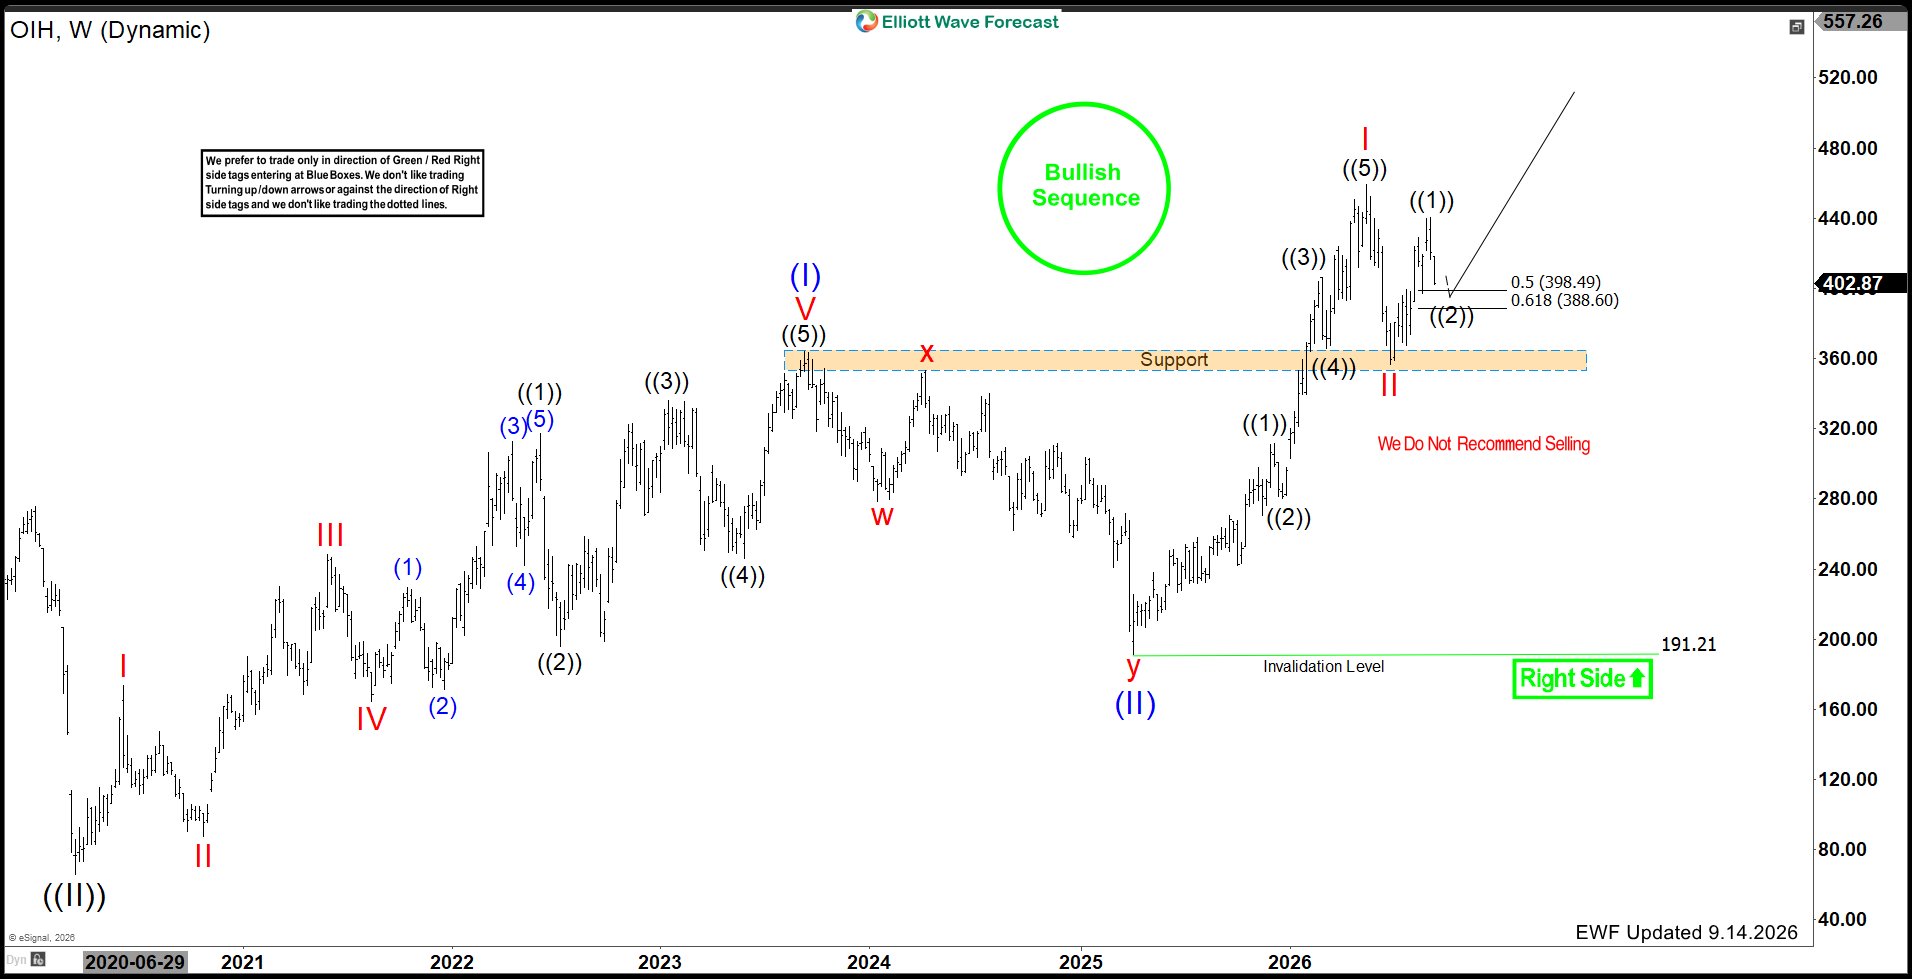
As a result, $OIH has entered a corrective wave ((2)) pullback. The current decline is expected to retrace part of the latest advance before buyers step back in. The key area to watch comes between the 50% and 61.8% Fibonacci retracement at 398.49–388.60, where support should begin to appear.
 Wave ((1)) Appears Complete
Looking at the weekly chart, $OIH rallied strongly from the July 2026 low and developed an impulsive structure. That advance unfolded through five waves and eventually completed wave ((1)) near the recent peak.
The completion of five waves naturally opens the door for a correction against that move. Therefore, the current weakness does not change the broader bullish outlook. Instead, it fits well with the expected wave ((2)) retracement before the next major leg higher begins.
Wave ((2)) Pullback Is Underway
$OIH has now started to correct the rally from the July 2026 low. This decline is being treated as wave ((2)), and the preferred view calls for a corrective pullback rather than a new bearish trend.
The current structure should allow price to retrace toward the 50%–61.8% Fibonacci area. Specifically, those levels come in at approximately 398.49 and 388.60.
This zone becomes important because second waves often retrace a meaningful portion of the preceding impulse before the larger trend resumes.
Buyers Expected Near 398.49–388.60
Most importantly, the 398.49–388.60 area should act as the next major support zone.
As $OIH approaches this region, selling pressure should begin to fade and buyers are expected to enter. A reaction from this area would support the view that wave ((2)) has completed and that the next impulsive advance is ready to begin.
For that reason, we do not favor chasing the downside into the retracement zone. Instead, the preferred approach is to watch for signs of support and a bullish reaction as price reaches the area.
Larger Bullish Sequence Remains Intact
The broader Elliott Wave structure remains strongly bullish. The double nest from the 2020 lows continues to suggest that the larger sequence is incomplete to the upside.
Therefore, once wave ((2)) finishes, $OIH should be positioned to begin another strong advance in wave ((3)). This would keep the larger bullish outlook intact and support significantly higher prices over time.
The long-term structure remains valid above the 191.21 invalidation level.
What Comes Next for $OIH
In the short term, $OIH can continue pulling back toward 398.49–388.60. Once the correction reaches that zone, buyers should begin to appear.
If a bullish reaction develops as expected, the next sequence should start to build higher from there. Consequently, the current decline should be viewed as a reset within the broader bullish trend rather than a change in direction.
Technical Summary
To summarize, $OIH appears to have completed wave ((1)), and a wave ((2)) correction is now underway.
The key support comes at the 50%–61.8% retracement between 398.49 and 388.60. Buyers are expected to enter near that area, potentially completing wave ((2)) and setting the stage for the next bullish leg.
As long as the larger structure remains intact, the current pullback should offer another opportunity to align with the dominant bullish sequence.


