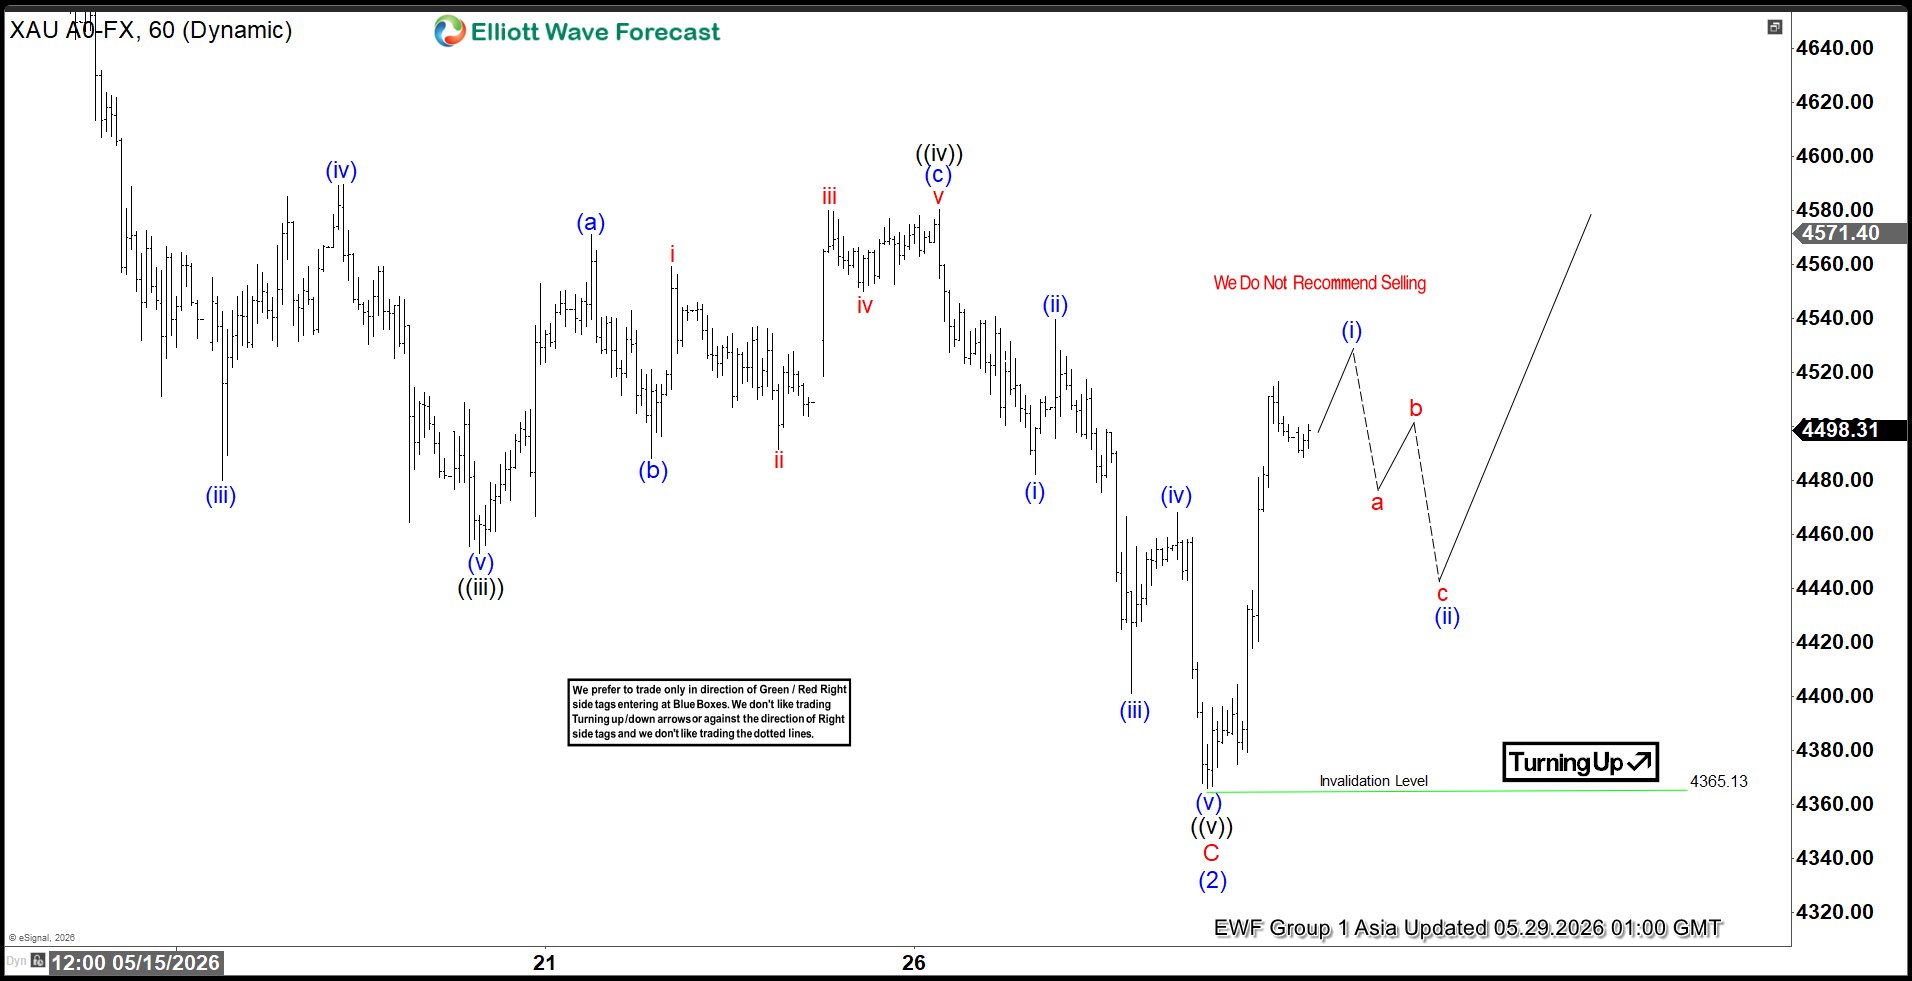
Gold (XAUUSD) has completed its cycle from the April 17 peak and is now positioned for a corrective rally in three waves. The decline from that peak ended at $4025, which marked the completion of wave ((W)). From this low, the market began a corrective phase in wave ((X)), unfolding as a zigzag Elliott Wave structure. Within this formation, wave (A) is developing as a five‑wave impulse, providing the initial leg of the correction.
From the June 11 low at wave ((W)), the first impulse wave advanced to $4118.14. A pullback in wave 2 followed, reaching $4051.88. The metal then resumed its upward trajectory, with wave 3 extending sharply to $4369.45. A subsequent retracement in wave 4 found support at $4305.21. The expectation is for gold to continue higher in wave 5, thereby completing wave (A) of the zigzag. Once this advance is complete, the market should enter wave (B), correcting the cycle from the June 11 low before resuming its rally in wave (C).
In the near term, the structural pivot at $4025 remains critical. As long as this level holds, dips are anticipated to find support within the typical three, seven, or eleven swing sequences. This framework suggests that corrective pullbacks will likely provide opportunities for renewed strength. The overall pattern highlights resilience above the $4025 low and maintains a constructive outlook for gold in the short to medium term. The sequence of waves continues to reinforce the bullish bias, with each retracement offering potential for continuation.