
What is Elliott Wave Analysis in Trading?
Elliott Wave Analysis is a powerful technical analysis method used to identify market cycles and predict future price movements. By recognizing repeating wave patterns, traders can anticipate trends and make informed trading decisions.
This approach is especially useful in volatile markets, where understanding structure and momentum is critical.
How Elliott Wave Helps Predict Market Trends
Elliott Wave Theory is based on the idea that markets move in repeating patterns:
- 5-wave impulse (trend direction)
- 3-wave correction (counter-trend)
For example:
When a trader identifies a completed 5-wave impulse followed by a 3-wave correction, it often signals that the trend will continue in the original direction.
👉 This allows traders to:
- Enter trades with higher probability
- Identify trend continuation
- Improve timing and risk management
Core Concepts of Elliott Wave Theory
1. Wave Cycle
The wave cycle is the foundation of Elliott Wave Theory. It helps traders determine where the market currently is and what comes next.
2. Wave Personality
Each wave behaves differently:
- Wave 3 → strongest momentum
- Wave 2 → sharp correction
- Wave 4 → sideways movement
Understanding these personalities improves wave count accuracy.
3. Wave Patterns
Each wave follows a specific structure, helping traders:
- Identify if a wave is complete
- Confirm trend direction
- Detect reversals
4. Fibonacci Ratios
Fibonacci levels help define:
- Entry zones
- Stop-loss levels
- Profit targets
They are essential for low-risk, high-probability trading setups.
The 3 Rules of Elliott Wave Theory
- Wave 2 cannot retrace beyond the start of Wave 1
- Wave 3 is never the shortest wave
- Wave 4 cannot overlap Wave 2
👉 These rules are critical for valid wave counting.

Real-World Challenges in Elliott Wave Trading
In practice, Elliott Wave is not always straightforward:
- Wave counts are often clearer in hindsight
- Traders may disagree on the current wave structure
- Market complexity can create confusion
However, one key advantage remains:
👉 Wave 3 is usually the strongest move
If traders can:
- Enter during Wave 3
- Manage Wave 4
- Ride Wave 5
They can capture significant profits.
Real Trading Examples Using Elliott Wave
USDCHF Elliott Wave Example (45-Min Chart)
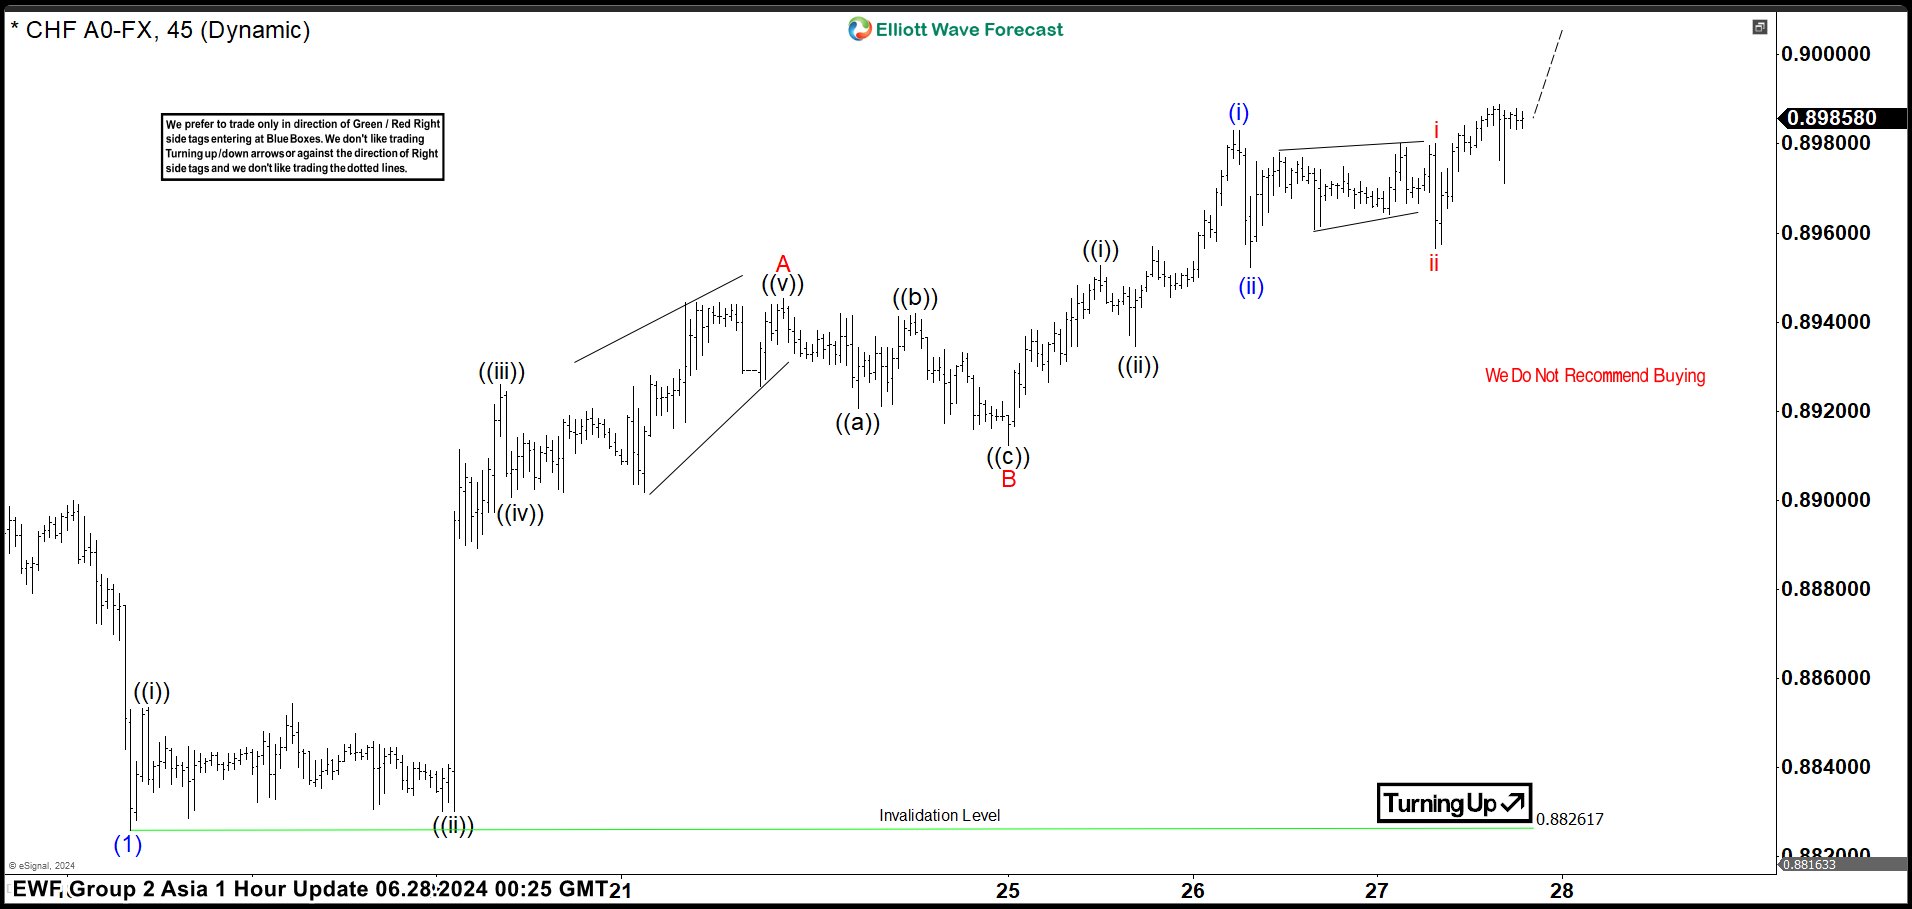
- Wave (1) completed at 0.882
- Wave (2) correction unfolding as zigzag
- Wave C currently in progress
👉 Key insight:
As long as 0.882 holds, expect continuation higher.
Identifying the Next High-Frequency Setup: USDCHF Forecast.
XOM (Exxon Mobil) Weekly Elliott Wave Analysis
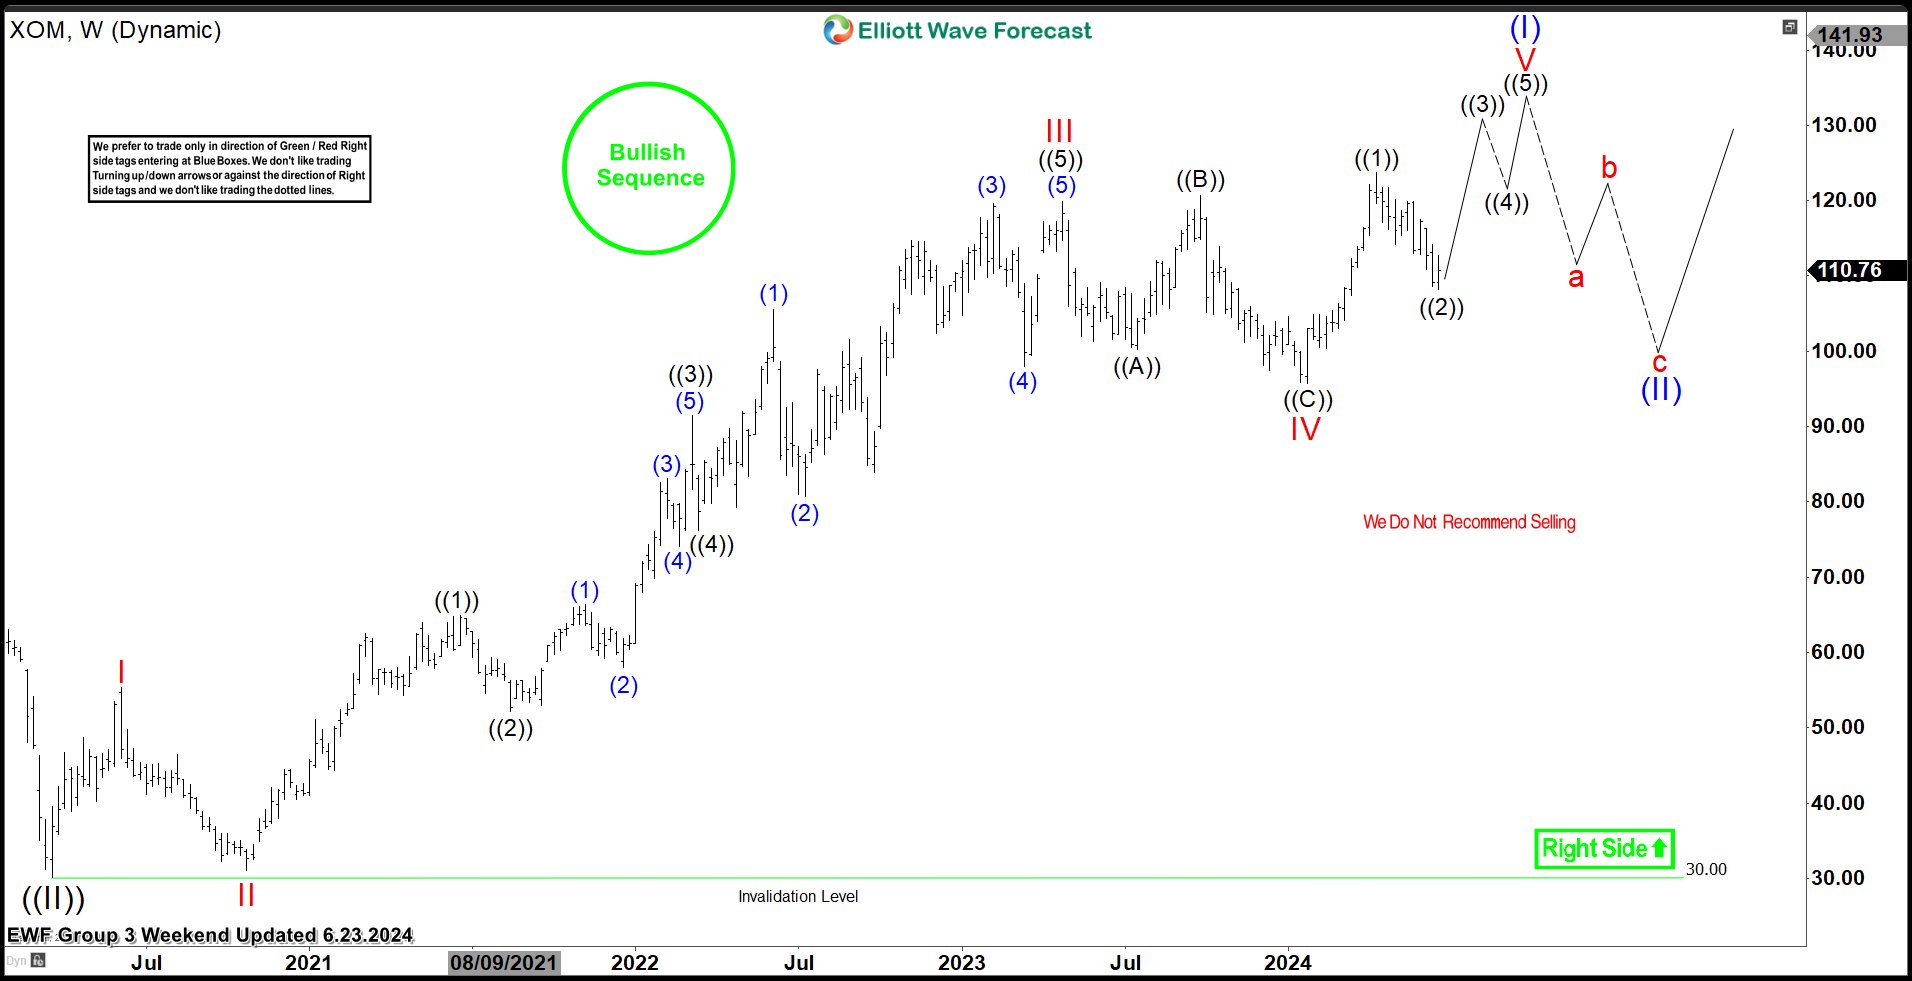
- Market in bullish cycle: Wave V of ((III))
- Wave ((2)) correction completed
- Wave ((3)) expected → new highs
👉 Strategy:
- Buy dips in bullish trend
- Focus on lower timeframe entries
Fractals & Market Behavior
Elliott Wave patterns are fractal in nature, meaning:
- They repeat across all timeframes
- The same structure appears on:
- 1-hour charts
- Daily charts
- Weekly charts
Subscribe to get chart updates now.
This self-similarity makes Elliott Wave highly powerful for:
- Multi-timeframe analysis
- Long-term forecasting
Conclusion: Is Elliott Wave Worth Learning?
Elliott Wave Theory is a high-skill trading method that can deliver powerful results when applied correctly.
However:
It cannot be mastered through theory alone
It requires practice, observation, and experience
Traders can succeed by:
- Practicing wave counts
- Studying real charts
- Learning from experienced analysts
As markets evolve, Elliott Wave remains one of the most effective tools for:
- Identifying turning points
- Forecasting trends
- Improving trading performance


