Exxon Mobil (XOM) continues to exhibit an incomplete bearish sequence from the March 30, 2026 high, maintaining a bias toward further downside. The broader structure suggests that the stock has yet to reach its extreme target zone, defined by the 100%–161.8% Fibonacci extension. This area, located between $107.9 and $129.2, is where buyers are expected to emerge and potentially stabilize the decline. Until then, the prevailing momentum favors weakness.
In the short term, the decline from the June 4, 2026 high is unfolding as an impulsive structure. Within this move, wave 1 terminated at $149.3, followed by a corrective rally in wave 2 that ended at $153.81. The stock then nested lower, with wave ((i)) concluding at $147.78 and wave ((ii)) retracing to $152.52. This sequence reinforced the bearish pressure and set the stage for deeper losses.
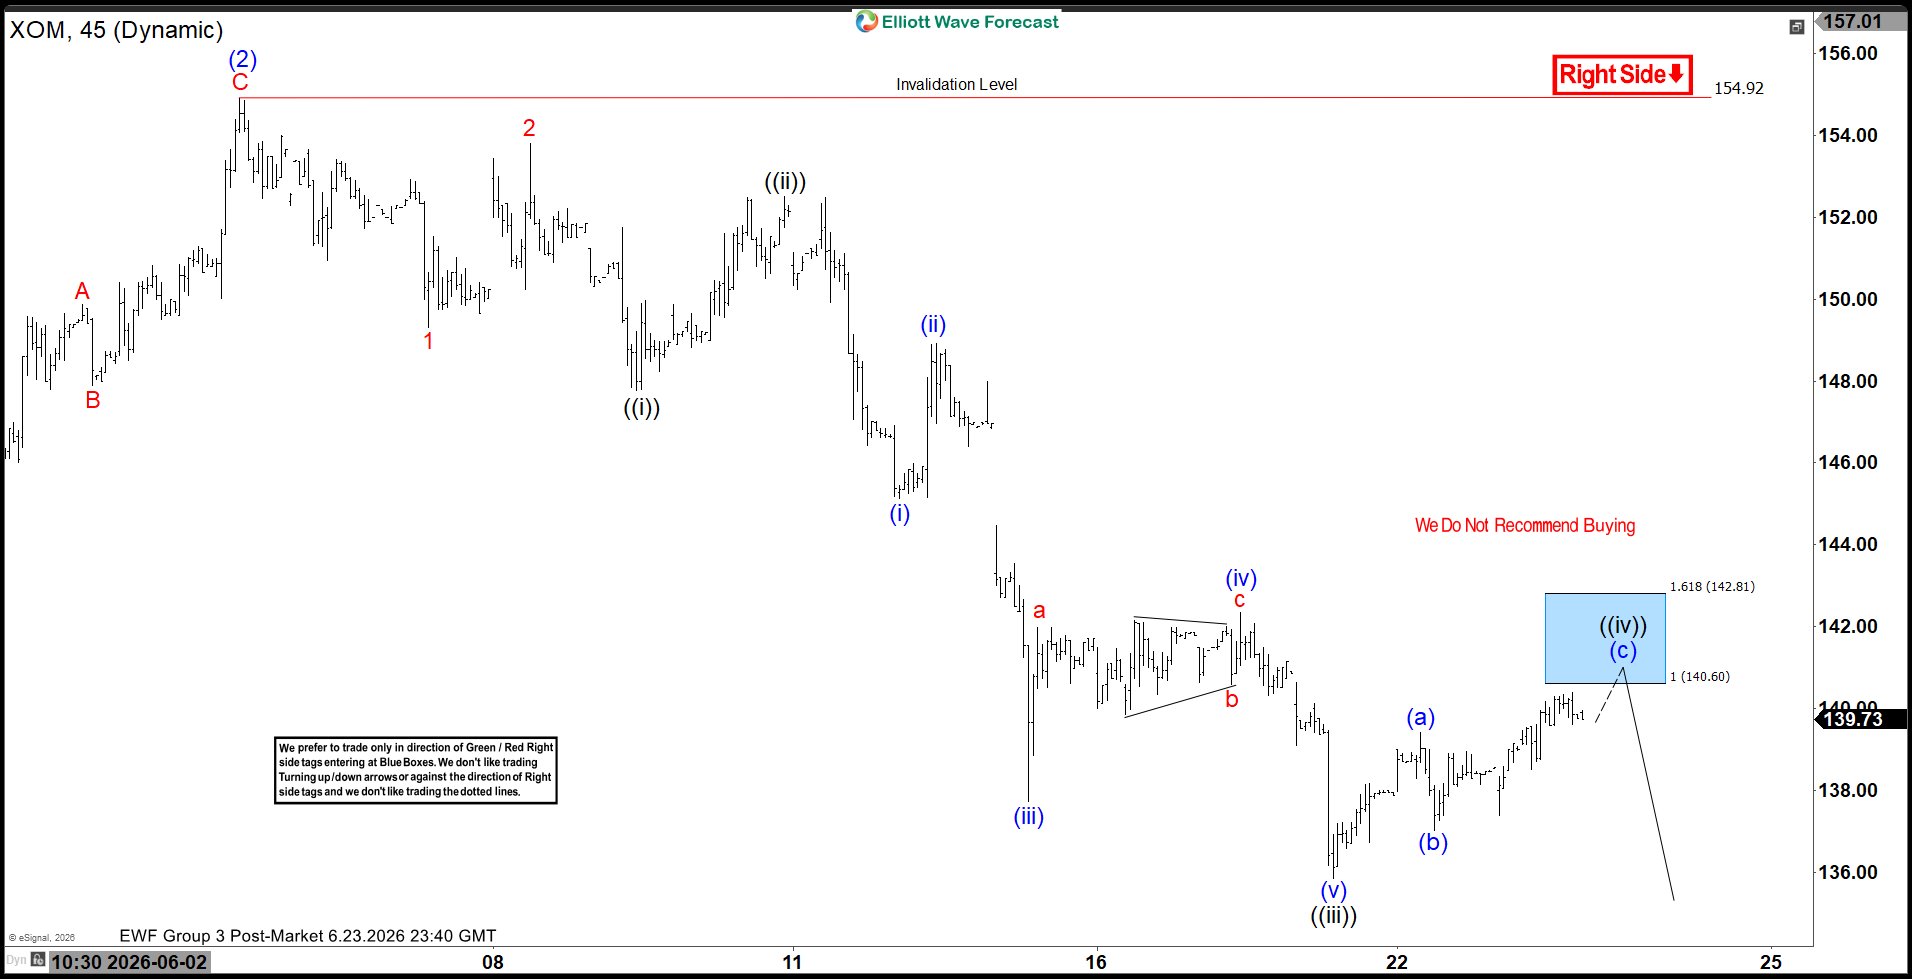
Subsequently, the market extended lower in wave ((iii)), reaching $135.85. At present, wave ((iv)) is advancing as a corrective rally, designed to retrace the cycle from the June 11 high. This rally is expected to unfold in either three or seven swings before the decline resumes. The projected resistance lies at the 100%–161.8% extension of wave (a), spanning $140.6–$142.81. Sellers are anticipated to reassert control within this zone, limiting the corrective strength.
Near term, the pivot at $154.92 remains decisive. As long as this level holds, rallies are expected to fail in three or seven swings, reinforcing the bearish outlook and favoring continuation toward the broader extension targets.