Every investor and trader faces the same challenge: determining where the market is likely to go next. To solve this problem, market participants typically rely on one of two approaches: fundamental analysis or technical analysis.
These methods have been used for decades by professional investors, traders, hedge funds, and financial institutions. While both aim to identify profitable opportunities, they approach the market from entirely different perspectives.
Fundamental analysis focuses on the intrinsic value of an asset by evaluating financial statements, earnings reports, economic conditions, and industry trends. Technical analysis focuses on price action, trading volume, and chart patterns to identify trends and potential entry and exit points.
The debate over which approach is superior has existed for years. However, many successful investors and traders understand that fundamental and technical analysis are not competitors-they are complementary tools that can provide a more complete picture of the market.
In this guide, we’ll explore how each method works, their key differences, advantages, limitations, and how combining both can improve your trading and investment results.
What Is Fundamental Analysis?
Fundamental analysis is the process of evaluating a financial asset by examining the economic, financial, and qualitative factors that influence its value.
The primary goal is to determine an asset’s intrinsic value and compare it with its current market price. If the market price is below the estimated intrinsic value, the asset may be considered undervalued. If it is trading above its intrinsic value, it may be overvalued.
Fundamental analysis is most commonly used for:
- Stocks
- ETFs
- Bonds
- Commodities
- Currencies
- Long-term investment portfolios
Unlike short-term trading methods, fundamental analysis focuses on understanding the actual worth of an investment rather than short-term price fluctuations.
Why Fundamental Analysis Matters
Market prices can be influenced by fear, greed, speculation, and short-term news events. Fundamental analysis helps investors look beyond market noise and focus on the underlying value of an asset.
For example, a company with strong earnings growth, low debt, healthy cash flow, and a competitive advantage may represent a valuable long-term investment even if its stock price temporarily declines.
This approach allows investors to identify opportunities before the broader market fully recognizes them.
Types of Fundamental Analysis
Fundamental analysis can generally be divided into two categories:
Quantitative Analysis
Quantitative analysis focuses on measurable financial data that helps investors assess a company’s financial strength, profitability, and overall performance. By examining financial statements and key metrics, investors can gain objective insights into how efficiently a business operates and whether it is financially healthy.
Some of the most commonly used quantitative indicators include Earnings Per Share (EPS), which measures the profit generated for each outstanding share; the Price-to-Earnings (P/E) ratio, which helps determine whether a stock is fairly valued relative to its earnings; and Return on Equity (ROE), which evaluates how effectively a company uses shareholder capital to generate profits. Investors also analyze the Debt-to-Equity (D/E) ratio to understand financial risk and leverage, as well as Free Cash Flow (FCF), which represents the cash remaining after operating expenses and capital expenditures have been paid. Companies with strong free cash flow often have greater flexibility to invest in growth initiatives, reduce debt, pay dividends, and withstand economic downturns.
Qualitative Analysis
Qualitative analysis focuses on factors that cannot be easily measured through financial statements or numerical data but can significantly influence a company’s long-term success. While quantitative analysis helps investors understand a company’s financial performance, qualitative analysis provides insight into the underlying strengths that drive future growth. Investors evaluate factors such as management quality, brand reputation, competitive advantages, corporate culture, and industry position. Strong leadership can shape strategic direction and profitability, while established brands often benefit from customer loyalty and pricing power. Similarly, companies with unique products, patented technologies, or dominant market positions may enjoy sustainable competitive advantages over their rivals. A healthy corporate culture can foster innovation, employee satisfaction, and operational excellence. By combining both qualitative and quantitative analysis, investors can develop a more complete understanding of a company’s true value and long-term growth potential.
Technical analysis becomes even more powerful when traders learn to recognize recurring market structures and patterns. Understanding Elliott Wave pattern recognition can help identify trend continuation and reversal opportunities with greater confidence.
The Three Core Components of Fundamental Analysis
Successful fundamental analysis typically consists of three layers:
1. Economic Analysis
Economic analysis focuses on evaluating the overall economic environment in which businesses and financial markets operate. Since economic conditions can significantly influence corporate performance, consumer behavior, and investor sentiment, understanding the broader economy is a crucial part of fundamental analysis. Investors examine key indicators such as interest rates, inflation, employment data, GDP growth, central bank policies, and consumer spending patterns to assess the health and direction of the economy. These factors often impact entire industries and asset classes, helping investors identify potential risks and opportunities before they are reflected in market prices. A strong economy generally supports business growth and higher corporate earnings, while economic slowdowns can create challenges for companies across multiple sectors.
2. Industry Analysis
Industry analysis examines the sector in which a company operates to understand the external factors that may influence its performance and future growth. Even the strongest companies can face challenges if their industry is experiencing declining demand, increased competition, or unfavorable regulations. Investors evaluate factors such as industry growth potential, the competitive landscape, market trends, regulatory requirements, and barriers to entry. Understanding these dynamics helps investors determine whether a company operates in a growing industry with long-term opportunities or in a sector facing structural challenges. By analyzing the broader industry environment, investors can better assess a company’s ability to maintain its competitive position and achieve sustainable growth over time.
3. Company Analysis
Company analysis is the most detailed and important component of fundamental analysis, as it focuses on evaluating the financial health, operational efficiency, and long-term growth potential of a specific business. Investors examine factors such as the company’s business model, revenue growth, profit margins, cash flow generation, debt levels, management effectiveness, and competitive advantages. They also assess future growth prospects, including expansion opportunities, product innovation, and market positioning. By thoroughly analyzing these areas, investors can gain a deeper understanding of a company’s strengths and weaknesses, determine whether it is financially sound, and identify opportunities that may offer attractive long-term returns.

What Is Technical Analysis?
Technical analysis is the study of price movements, trading volume, and market behavior to forecast future price action. Unlike fundamental analysis, which focuses on a company’s intrinsic value, technical analysis examines how market participants are interacting with an asset.
The core principle behind technical analysis is simple: all known information is already reflected in the price. By studying price action and historical patterns, traders attempt to identify opportunities before major market moves occur.
Technical analysis is widely used in:
- Stocks
- Forex
- Commodities
- Cryptocurrencies
- Futures
- Options markets
Because it focuses on market behavior rather than financial statements, technical analysis is especially popular among short-term and medium-term traders.
Learning technical analysis is easier when concepts are applied to real charts. Reviewing Elliott Wave analysis using real market setups can help traders better understand trend development, corrective structures, and potential reversal zones.
Why Traders Use Technical Analysis
Technical analysis helps traders answer one of the most important questions in the market:
When should I enter or exit a trade?
While fundamental analysis can help investors identify assets with strong long-term potential, technical analysis helps determine the most favorable time to enter or exit a trade. By studying price action, market trends, and trading volume, traders can gain valuable insights into market behavior and make more informed decisions. Technical analysis is commonly used to identify trends, locate key support and resistance levels, spot potential market reversals, determine entry and exit points, set stop-loss levels, establish profit targets, and measure momentum and volatility. As a result, it has become an essential tool for active traders seeking a structured approach to market timing, risk management, and trade execution.
The Core Principles of Technical Analysis
Most technical trading strategies are built around three key assumptions:
1. The Market Discounts Everything
Technical analysts believe that all available information-including economic data, earnings reports, news events, and investor sentiment-is already reflected in price.
Instead of analyzing every factor individually, traders focus on the final result: price action.
2. Price Trends Tend to Persist
Markets often move in trends rather than random directions.
An uptrend tends to remain in place until evidence suggests otherwise, while downtrends often continue until buyers regain control.
This principle forms the foundation of trend-following strategies.
3. History Often Repeats Itself
Human emotions such as fear, greed, optimism, and panic remain constant over time.
Because market psychology tends to repeat, similar chart patterns frequently appear across different markets and timeframes.
Common Chart Patterns Used in Technical Analysis
Chart patterns provide visual clues about market psychology and potential future price movements.
Some of the most widely used patterns include:
Continuation Patterns
These suggest the existing trend may continue.
Examples include:
- Bull Flags
- Bear Flags
- Pennants
- Rectangles
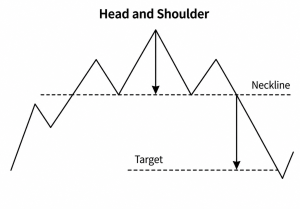
Reversal Patterns
These indicate a possible change in trend direction.
Examples include:
- Head and Shoulders
- Inverse Head and Shoulders
- Double Tops
- Double Bottoms
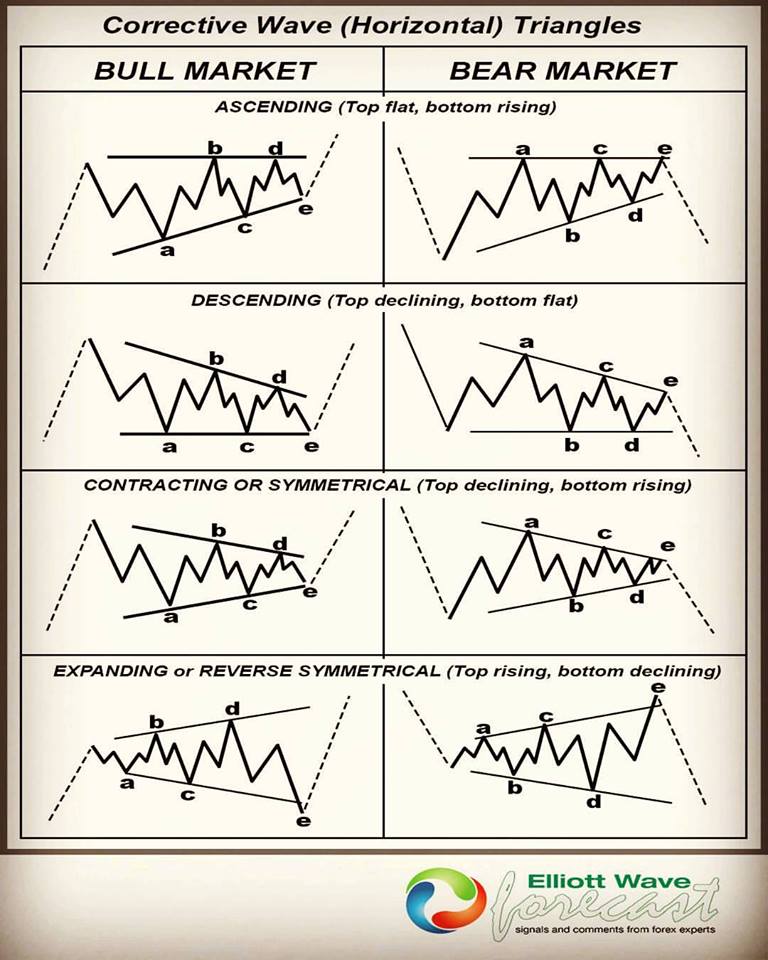
 Triangle Patterns
Triangles often signal periods of consolidation before a significant breakout.
Common triangle formations include:
- Ascending Triangle
- Descending Triangle
- Symmetrical Triangle
Understanding these patterns can help traders identify potential opportunities before major market moves occur.
Fundamental Analysis vs Technical Analysis
Although both methods seek to improve investment decisions, they differ significantly in their approach.
| Aspect | Fundamental Analysis | Technical Analysis |
|---|---|---|
| Focus | Intrinsic value and financial health | Price action and market behavior |
| Data Used | Financial statements, earnings, economic indicators | Price charts, volume, indicators |
| Time Horizon | Long-term | Short-term to medium-term |
| Primary Goal | Determine fair value | Identify trading opportunities |
| Decision Basis | Company performance | Market sentiment and trends |
| Common Users | Investors | Traders |
| Risk Management | Less timing-focused | Strong focus on entries and exits |
Which Is Better: Fundamental or Technical Analysis?
The answer depends on your objectives.
If your goal is long-term investing, fundamental analysis can help identify quality assets with strong growth potential.
If your goal is active trading, technical analysis can provide valuable insights into timing, momentum, and market structure.
However, many experienced market participants combine technical analysis and fundamental analysis.
For example:
- Use fundamental analysis to identify strong investment opportunities.
- Use technical analysis to determine the best entry and exit points.
This combination often provides a more balanced and effective decision-making process.
How Elliott Wave Analysis Fits Into Technical Analysis
Elliott Wave Theory is a specialized form of technical analysis that focuses on recurring market cycles driven by investor psychology.
Rather than relying solely on traditional indicators, Elliott Wave practitioners analyze market structure through impulsive and corrective wave patterns.
This approach helps traders:
- Identify trend direction
- Anticipate corrective pullbacks
- Forecast future price targets
- Improve risk-to-reward opportunities
When combined with support and resistance levels, Fibonacci relationships, and market structure analysis, Elliott Wave can provide a powerful framework for understanding market behavior across multiple timeframes.
Top Fundamental Analysis Indicators
Fundamental investors rely on a variety of financial metrics to evaluate a company’s financial strength, profitability, and long-term growth potential. While no single indicator tells the entire story, using several metrics together can provide a clearer picture of a company’s true value.
Earnings Per Share (EPS)
Earnings Per Share measures how much profit a company generates for each outstanding share of stock. Consistent EPS growth often indicates a healthy and growing business.
Price-to-Earnings Ratio (P/E)
The P/E ratio compares a company’s stock price to its earnings per share. Investors commonly use this metric to determine whether a stock appears undervalued or overvalued relative to its earnings.
PEG Ratio (Price/Earnings to Growth)
The PEG ratio builds upon the P/E ratio by incorporating future earnings growth expectations. It provides a more complete view of valuation by considering both current earnings and projected growth.
Free Cash Flow (FCF)
Free Cash Flow represents the money remaining after a company covers its operating expenses and capital expenditures. Strong free cash flow often indicates financial stability and flexibility.
Price-to-Book Ratio (P/B)
The P/B ratio compares a company’s market value to its book value. It is particularly useful when evaluating asset-heavy businesses.
Return on Equity (ROE)
ROE measures how effectively management uses shareholders’ capital to generate profits. Higher ROE values generally indicate better operational efficiency.
Dividend Payout Ratio (DPR)
This ratio shows the percentage of earnings returned to shareholders through dividends. It can help investors evaluate dividend sustainability.
Price-to-Sales Ratio (P/S)
The P/S ratio compares a company’s market capitalization to its revenue and is particularly useful when evaluating growth companies that may not yet be profitable.
Dividend Yield
Dividend yield measures the annual dividend payment relative to the stock price. Income-focused investors often use this metric when selecting investments. Get to know the best dividend socks.
Debt-to-Equity Ratio (D/E)
The D/E ratio measures financial leverage by comparing debt to shareholder equity. Lower ratios often indicate lower financial risk, although acceptable levels vary by industry.
Top Technical Analysis Indicators
Technical traders use indicators to identify trends, momentum, volatility, and potential turning points in the market.
Moving Averages
Moving averages smooth price fluctuations and help traders identify the underlying trend direction. Common versions include the 50-day and 200-day moving averages.
Relative Strength Index (RSI)
RSI is a momentum indicator that measures the speed and magnitude of price changes. Readings above 70 often indicate overbought conditions, while readings below 30 may indicate oversold conditions.
MACD (Moving Average Convergence Divergence)
MACD combines trend-following and momentum analysis to identify potential buy and sell signals.
Bollinger Bands
Bollinger Bands measure market volatility and help traders identify potential breakout opportunities and overextended price movements.
Fibonacci Retracement
Fibonacci retracement levels help traders identify potential support and resistance zones during market corrections.
On-Balance Volume (OBV)
OBV tracks buying and selling pressure by combining price action with trading volume.
Accumulation/Distribution Line
This indicator helps determine whether institutional money is flowing into or out of a particular asset.
Stochastic Oscillator
The stochastic oscillator compares current price levels to recent trading ranges and helps identify momentum shifts.
Can Fundamental and Technical Analysis Be Used Together?
Absolutely.
One of the biggest mistakes investors make is treating fundamental and technical analysis as opposing strategies. In reality, many professional traders and investors use both methods together.
A common approach is:
Step 1: Use Fundamental Analysis
Identify companies or assets with strong fundamentals, healthy financials, competitive advantages, and long-term growth potential.
Step 2: Use Technical Analysis
Use chart patterns, market structure, support and resistance levels, and momentum indicators to identify optimal entry and exit points.
This combination allows investors to improve both asset selection and trade timing.
For example, an investor may discover a fundamentally strong company but wait for technical confirmation before entering a position. This approach can improve risk management and overall returns.
Frequently Asked Questions
What is the main difference between fundamental and technical analysis?
Fundamental analysis focuses on determining an asset’s intrinsic value by examining financial and economic factors. Technical analysis focuses on price action, volume, and market trends to identify trading opportunities.
Which is better for beginners?
Both approaches have value. Fundamental analysis is often easier for long-term investors to understand, while technical analysis may appeal more to active traders looking for precise entry and exit points.
Can technical analysis predict the future?
No analysis method can predict the future with certainty. Technical analysis helps traders identify probabilities and potential scenarios based on historical market behavior.
Is technical analysis useful for long-term investing?
Yes. Many long-term investors use technical analysis to improve entry timing and manage risk even when their investment decisions are based primarily on fundamentals.
Do professional traders use both methods?
Many hedge funds, institutional investors, and professional traders combine fundamental and technical analysis to gain a more comprehensive view of the market.
Where Does Elliott Wave Analysis Fit?
Elliott Wave Theory falls under technical analysis. It focuses on market structure, investor psychology, and recurring wave patterns to forecast potential future price movements.
Many traders combine Elliott Wave analysis with Fibonacci relationships, support and resistance levels, and other technical tools to improve market forecasts.
Conclusion
Fundamental analysis and technical analysis are two of the most widely used approaches for evaluating financial markets. While they differ significantly in methodology, both offer valuable insights.
Fundamental analysis helps investors determine whether an asset is worth owning by examining its intrinsic value, financial strength, and growth prospects. Technical analysis helps traders identify trends, momentum, support and resistance levels, and potential entry and exit opportunities.
Rather than choosing one approach over the other, many successful market participants use both. Fundamental analysis can identify high-quality opportunities, while technical analysis can improve timing and risk management.
The most effective strategy often combines the strengths of both methods. By understanding what to buy and when to buy it, investors can make more informed decisions and improve their long-term results.
Whether you’re a long-term investor, swing trader, or active market participant, developing a solid understanding of both fundamental and technical analysis can provide a significant advantage in today’s financial markets.


