The S&P 500 has many exchange-traded funds (ETFs) designed to duplicate its performance. These funds are used by many investors to include in their portfolios.
How to Choose an S&P 500 ETF?
There is no best ETF. The right ETF is everyone’s personal choice. However, before considering which ETF is the best for you here are a few key points to consider:
- Expense ratios: The expense ratio of ETFs is usually in the form of 0.03% or 0.0945%. While they seem very low, these fees can add up to huge amounts, over the long run, when the total portfolio is considered.
- Trading costs: These vary from broker to broker. Fortunately, most major brokerages no longer charge commissions on ETFs, stocks, or options trades.
- Price: The price at which the fund is trading continues to vary. And it affects the number of shares an investor can buy from his fixed amount of money.
- Yield and return: The yield and return vary across all. The returns change over time. Hence there is no guarantee an ETF providing the highest return today will give the same return in the future.
- High Liquidity: The more liquid an ETF, the easier it is to convert your shares into cash by selling them.
Check our updates for S&P500 forecast, news, and analysis.
List of the Best S&P 500 ETFs for 2024
Here we are discussing the 10 best S&P 500 ETFs for 2024:
- iShares Core S&P 500 ETF (IVV)
- Vanguard S&P 500 ETF (VOO)
- SPDR Portfolio S&P 500 (SPLG)
- SPDR S&P 500 ETF (SPY)
- iShares S&P 500 Growth ETF (IVW)
- Invesco S&P 500 Equal Weight ETF (RSP)
- Invesco S&P 500 Low Volatility (SPLV)
- ProShares Ultra S&P 500 (SSO)
- SPDR Portfolio S&P 500 Growth ETF
- Fidelity 500 Index Fund (FXAIX)
iShares Core S&P 500 ETF (IVV)
The iShares Core S&P 500 ETF seeks to track the investment results of an index composed of large-capitalization U.S. equities. Reasons to invest in this ETF are:
- It provides exposure to large, established U.S. companies
- It is low-cost, tax-efficient access to 500 of the largest-cap U.S. stocks
- Use at the core of your portfolio to seek long-term growth
| 1 – Year | 3- Year | 5 Year | 10 Year | Since Inception | |
| NAV | -18.13 % | 7.63 % | 9.39 % | 12.52 % | 6.35 % |
| Market Price | -18.16 % | 7.65 % | 9.36 % | 12.51 % | 6.34 % |
| Benchmark | -18.11 % | 7.66 % | 9.42 % | 12.56 % | 6.41 % |
Launched in May 2000, it has a Net Asset value of $ 290 billion with an expense ratio of 1.69 %.
The top 10 holdings of this fund are:
| Sr | Sector Allocation | Percentage |
| 1 | Apple Inc. | 6.03 % |
| 2 | Microsoft Corp. | 5.55 % |
| 3 | Amazon | 2.31 % |
| 4 | Berkshire Hathaway | 1.73 % |
| 5 | Alphabet Inc. Class A | 1.64 % |
| 6 | United Health Group | 1.54 % |
| 7 | Alphabet Inc. Class B | 1.46 % |
| 8 | Johnson and Johnsons | 1.43 % |
| 9 | Exxon Mobil | 1.41 % |
| 10 | JP Morgan Chase | 1.22 % |
Check out the best gold trading signal providers.
Vanguard S&P 500 ETF (VOO)
VOO tracks a market-cap-weighted index of US large- and mid-cap stocks selected by the S&P Committee. VOO captures the large-cap space well. The fund tracks its index extremely well. However, like all S&P 500 funds, it defines large-caps as the S&P Committee sees it, which means it includes a fairly large allocation to firms that we consider to be midcaps. Still, VOO offers excellent US large-cap coverage. The fund competes in a crowded space. VOO stumbles slightly on transparency: it discloses holdings monthly with a lag, not daily like its peers. However, it can reinvest dividends when paid. The ETF is technically part of a larger Vanguard portfolio that includes S&P 500 mutual fund share classes, an arrangement with little to no practical impact on VOO investors.
Launched in 2010, it has an expense ratio of 0.03 %. The total Assets under management of this fund are $ 282.26 billion.
| As Of | 1 Month | QTD | YTD | 1 Year | 3 Year | 5 Year | 10 Year | Since Inception
Nov 08, 2005 |
|
| NAV | Jan 31, 2023 | 6.28 % | 6.28 % | 6.28 % | -8.2 5% | 9.84 % | 9.63 % | 12.58 % | 9.45 % |
| Market Value | Jan 31, 2023 | 6.27 % | 6.27 % | 6.27 % | -8.17 % | 9.85 % | 9.62 % | 12.58 % | 9.45 % |
| S&P 500 Index | Jan 31, 2023 | 6.28 % | 6.28 % | 6.28 % | -8.22 % | 9.88 % | 9.67 % | 12.65 % | 9.54 % |
The top 10 sectoral holdings of this fund are:
| Sr | Sector Allocation | Percentage |
| 1 | Information Technology | 27.44% |
| 2 | Health Care | 14.41% |
| 3 | Financials | 11.63% |
| 4 | Consumer Discretionary | 10.68% |
| 5 | Industrials | 8.33% |
| 6 | Communication Services | 7.80% |
| 7 | Consumer Staples | 6.57% |
| 8 | Energy | 4.87% |
| 9 | Utilities | 2.82% |
| 10 | Real Estate | 2.75% |
Also, learn:
 SPDR Portfolio S&P 500 (SPLG)
The SPDR Portfolio S&P 500 ETF seeks to provide investment results that, before fees and expenses, correspond generally to the total return performance of the S&P 500 Index.
It is one of the low-cost core SPDR Portfolio ETFs, a suite of portfolio building blocks designed to provide broad, diversified exposure to core asset classes. This ETF seeks to offer precise, comprehensive exposure to the US large-cap market segment.
The Index represents approximately 80% of the US market.
The below chart shows the NAV of the fund in comparison with S&P 500 index:
 Launched in Nov 2005, it has an expense ratio of 0.03 %. The total Assets under management of this fund are $ 16 billion.
The top 10 holdings of this fund are:
| Sr | Companies | Percentage |
| 1 | Apple Inc. | 6.04 % |
| 2 | Microsoft Corp. | 5.55 % |
| 3 | Amazon | 2.32 % |
| 4 | Berkshire Hathaway | 1.73 % |
| 5 | Alphabet Inc. Class A | 1.64 % |
| 6 | United Health Group | 1.54 % |
| 7 | Alphabet Inc. Class C | 1.46 % |
| 8 | Johnson and Johnsons | 1.43 % |
| 9 | Exxon Mobil | 1.41 % |
| 10 | JP Morgan Chase | 1.22 % |
Checkout:
- Accurate and Reliable Gold Forecast
- Reliable and Trusted Commodity Signals
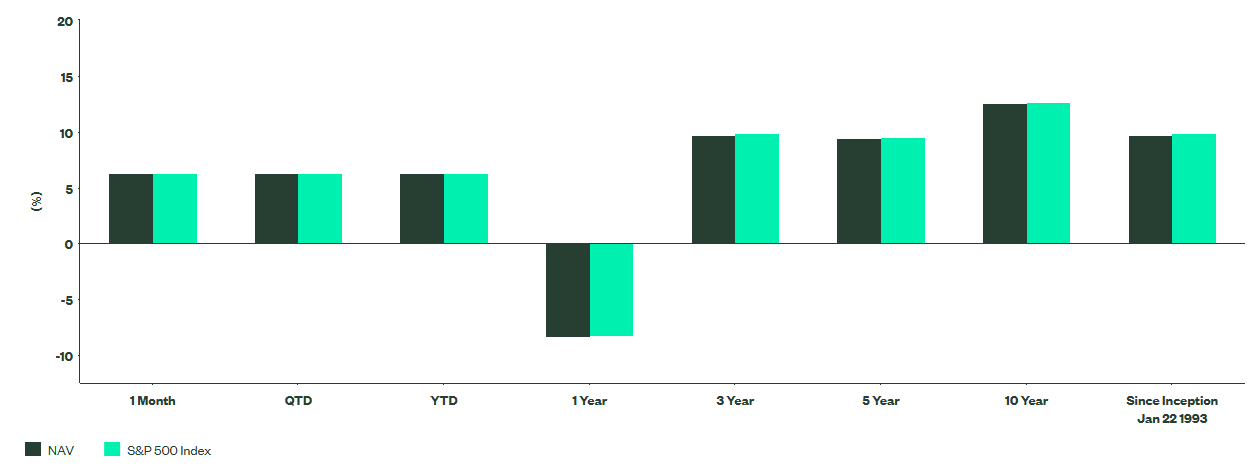
SPDR S&P 500 ETF (SPY)
SPY aims to replicate the performance of the S&P 500 Index as closely as possible by investing in the same stocks that are included in the index in the same weightings. SPY is traded on the New York Stock Exchange (NYSE Arca) and is highly liquid, making it a popular choice for investors looking to gain broad exposure to the US stock market.
Launched in Jan 1993, it has an expense ratio of 0.03 %. The total Assets under management of this fund are $ 377 billion.
The below chart shows the NAV of the fund in comparison with S&P 500 index:
The below table shows the performance of the ETF as of December 31, 2022:
| YTD | 1 Year | 3 Year | 5 Year | 10 Year | Fund Inception | |
| ETF NAV | -11.67 % | -11.67 % | 8.82 % | 8.91 % | 12.09 % | 10.81 % |
| ETF Market Price | -11.89 | -11.89 | 8.84 % | 8.89 % | 12.08 % | 10.81 % |
| Underlying Index | -11.45 | -11.45 | 9.01 % | 9.11 % | 12.4 % | 11.27 % |
| Benchmark | -18.11 | -18.11 | 7.66 % | 9.42 % | 12.56 % | 9.74 % |
The top 10 holdings of this fund are:
| Sr | Sector Allocation | Percentage |
| 1 | Information Technology | 14.86 % |
| 2 | Industrials | 14.02 % |
| 3 | Financials | 13.50 % |
| 4 | Health Care | 12.77 % |
| 5 | Consumer Discretionary | 11.02 % |
| 6 | Consumer Staples | 6.62 % |
| 7 | Utilities | 6.10 % |
| 8 | Real Estate | 6.09 % |
| 9 | Materials | 5.68 % |
| 10 | Energy | 4.98 % |
iShares S&P 500 Growth ETF (IVW)
IVW is one of the most established and popular growth-focused ETFs, holding firms with growth characteristics from the S&P 500 Index. S&P’s style methodology selects companies based on three growth factors: sales growth, earnings growth, and momentum. IVW was one of the first growth-focused ETFs to launch. The portfolio shows only modest sector tilts compared to our large-cap-growth benchmark, with a small but persistent bias toward midcaps.
Launched in May 2000, it has an expense ratio of 0.18 %. The total Assets under management of this fund are $ 29.5 billion.
| Performance [as of 02/09/23] | 1 month | 3 months | YTD | 1 Year | 3 Years | 5 Years | 10 Years |
| IVW | 6.36 % | 9.20 % | 6.41 % | -19.14 % | 7.50 % | 11.50 % | 13.48 % |
| IVW (NAV) | 6.38 % | 9.21 % | 6.39 % | -19.16 % | 7.50 % | 11.52 % | 13.48 % |
| S&P 500 Growth Index | 6.40 % | 9.26 % | 6.42 % | -19.03 % | 7.69 % | 11.71 % | 13.68 % |
| MSCI USA Large Cap Growth Index | 11.34 % | 15.04 % | 12.62 % | -18.18 % | 8.85 % | 13.56 % | 14.89 % |
The fund has invested in the following sectors:
| Sr | Sector Allocation | Percentage |
| 1 | Electronic Technology | 21.9 % |
| 2 | Technology Services | 17.56 % |
| 3 | Health Technology | 14.84 % |
| 4 | Energy Minerals | 7.35 % |
| 5 | Retail Trade | 6.24 % |
| 6 | Consumer Non-Durables | 5.65 % |
| 7 | Finance | 5.42 % |
| 8 | Commercial Services | 4.28 % |
| 9 | Health Services | 4.11 % |
| 10 | Consumer Durables | 3.25 % |
Checkout:
- Best crypto signals
- Best undervalued stocks
- Best stock indicators
- Top trading blogs
- Best regional bank stocks
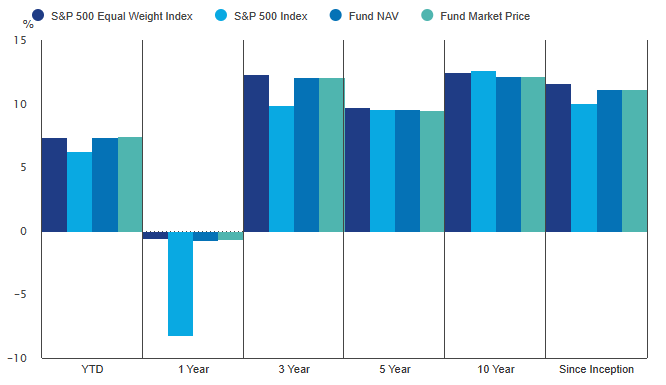
Invesco S&P 500 Equal Weight ETF (RSP)
The Invesco S&P 500® Equal Weight ETF (Fund) is based on the S&P 500® Equal Weight Index (Index). The Fund will invest at least 90% of its total assets in securities that comprise the Index. The Index equally weights the stocks in the S&P 500® Index. The Fund and the Index are rebalanced quarterly.
Below is the fund performance showing the ETF’s total return index, the S&P 500 index, the fund’s NAV, and the fund’s market price:
| Index History (%) | YTD | 1 Year | 3 Year | 5 Year | 10 Year | Since Inception |
| S&P 500 Equal Weight Index | 7.39 | -0.58 | 12.31 | 9.71 | 12.49 | 11.62 |
| S&P 500 Index | 6.28 | -8.22 | 9.88 | 9.54 | 12.68 | 10.03 |
The fund has invested in the following sectors:
| Sr | Sector Allocation | Percentage |
| 1 | Information Technology | 14.86 % |
| 2 | Financials | 13.5 % |
| 3 | Health care | 12.77 % |
| 4 | Consumer Discretionary | 11.02 % |
| 5 | Consumer Staples | 6.62 % |
| 6 | Utilities | 6.1 % |
| 7 | Real Estate | 6.09 % |
| 8 | Materials | 5.68 % |
| 9 | Energy | 4.98 % |
| 10 | Communication Services | 4.36 % |
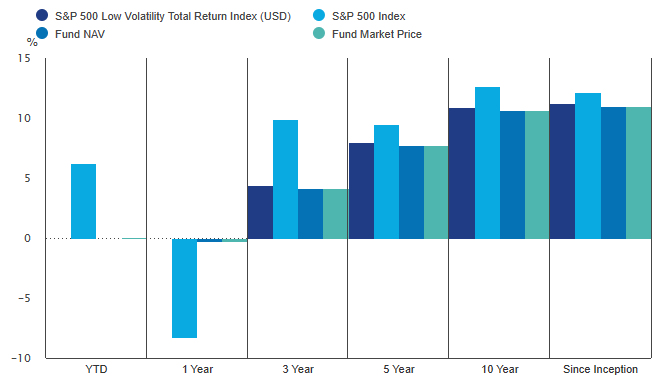
Invesco S&P 500 Low Volatility (SPLV)
The Invesco S&P 500 Low Volatility ETF (Fund) is based on the S&P 500 Low Volatility Index (Index). The Fund will invest at least 90% of its total assets in the securities that comprise the Index. The Index is compiled, maintained, and calculated by Standard & Poor’s and consists of the 100 securities from the S&P 500 Index with the lowest realized volatility over the past 12 months. Volatility is a statistical measurement of the magnitude of up and down asset price fluctuations over time.
Below is the fund performance showing the ETF’s total return index, the S&P 500 index, the fund’s NAV, and the fund’s market price:
| INDEX HISTORY (%) | YTD | 1YR | 3YR | 5YR | 10YR | Since Inception |
| S&P 500 Low Volatility Total Return Index (USD) | 0.03 | -0.01 | 4.45 | 8.03 | 10.93 | 11.27 |
| S&P 500 Index | 6.28 | -8.22 | 9.88 | 9.54 | 12.68 | 12.17 |
The fund has invested in the following sectors:
| Sr | Sector Allocation | Percentage |
| 1 | Utilities | 26.26 % |
| 2 | Consumer Staples | 21.35 % |
| 3 | Health care | 14.89 % |
| 4 | Industrials | 12.04 % |
| 5 | Financials | 11.79 % |
| 6 | Real Estate | 5.97 % |
| 7 | Consumer Discretionary | 11.02 % |
| 8 | Information Technology | 2.81 % |
| 9 | Communication Services | 1.08 % |
| 10 | Materials | 5.68 % |
Checkout:
- Best drone stocks
- Forex Signals providers
- Best NFT stocks
- Best swing trading stocks
- Technical analysis books
ProShares Ultra S&P 500 (SSO)
The Fund seeks daily investment results, before fees and expenses, that correspond to two times (2x) the return of the S&P 500 Index (the Index) for a single day, not for any other period. It is a float-adjusted, market capitalization-weighted index of 500 U.S. operating companies and real estate investment trusts.
The below chart shows the performance of the fund over the past quarter in comparison to the S&P 500.
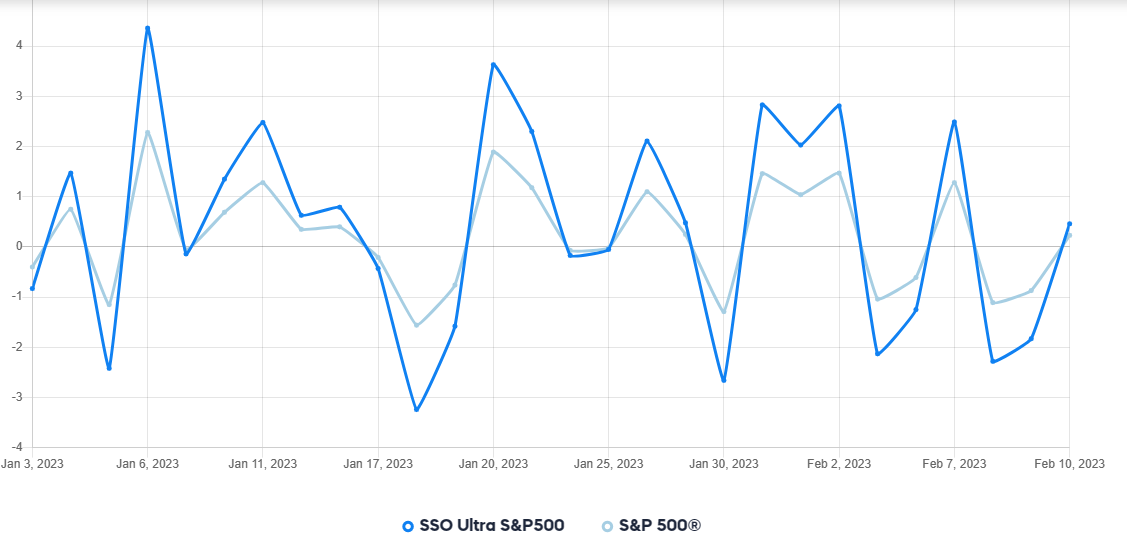
| YTD | 1 year | 3 years | 5 years | 10 Years | Since Inception | |
| SSO Market Price | 38.98 % | -38.98 % | 5.99 % | 10.69 % | 19.95 % | 11.56 % |
| S&P 500 Index | -38.94 % | -38.94 % | 5.97 % | 10.77 % | 19.97 % | 11.57 % |
The fund has invested in the following sectors:
| Sr | Sector Allocation | Percentage |
| 1 | Information Technology | 25.74 % |
| 2 | Health Care | 15.82 % |
| 3 | Financials | 11.66 % |
| 4 | Consumer Discretionary | 9.80 % |
| 5 | Industrials | 8.65 % |
| 6 | Communication Services | 7.28 % |
| 7 | Consumer Staples | 7.20 % |
| 8 | Energy | 5.23 % |
| 9 | Utilities | 3.18 % |
| 10 | Materials | 2.73 % |
SPDR Portfolio S&P 500 Growth ETF
The SPDR Portfolio S&P 500 Growth ETF seeks to provide investment results that, before fees and expenses, correspond generally to the total return performance of the S&P 500 Growth Index.
It is one of the low-cost core SPDR Portfolio ETFs, a suite of portfolio building blocks designed to provide broad, diversified exposure to core asset classes. This low-cost ETF seeks to offer exposure to S&P 500 companies that display the strongest growth characteristics. The Index contains stocks that exhibit the strongest growth characteristics based on: sales growth, earnings change to price ratio, and momentum.
Launched in Sept 2000, it has an expense ratio of 0.04 %. The total Assets under management of this fund are $ 14.9 billion.
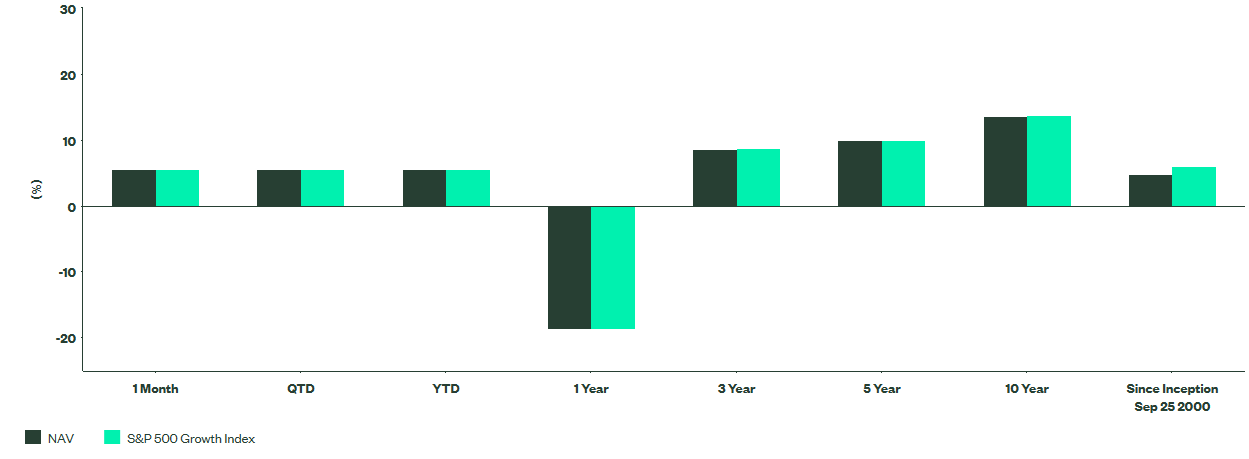
| As Of | 1 Month | QTD | YTD | 1 Year | 3 Year | 5 Year | 10 Year | Since Inception | |
| NAV | Jan 31, 2023 | 5.61 % | 5.61 % | 5.61 % | -18.64 % | 8.66 % | 9.89 % | 13.64 % | 4.74 % |
| Market Value | Jan 31, 2023 | 5.62% | 5.62% | 5.62% | -18.58% | 8.68% | 9.88% | 13.64% | 4.74% |
| S&P 500 Growth Index | Jan 31, 2023 | 5.62% | 5.62% | 5.62% | -18.62% | 8.71% | 9.94% | 13.77% | 6.02% |
The fund has invested in the following sectors:
| Sr. | Sector | Weight |
| 1 | Information Technology | 36.55% |
| 2 | Health Care | 19.51% |
| 3 | Consumer Discretionary | 10.28% |
| 4 | Energy | 8.14% |
| 5 | Consumer Staples | 6.61% |
| 6 | Communication Services | 6.60% |
| 7 | Industrials | 4.97% |
| 8 | Financials | 3.60% |
| 9 | Materials | 2.34% |
| 10 | Real Estate | 0.86% |
| 11 | Utilities | 0.53% |
Also read:
- Best day trading stocks
- Best stock advisor service
- Best forex indicators
- Best preferred stocks
- Best penny stocks to invest in
- Best crypto day trading strategies
Fidelity 500 Index Fund (FXAIX)
The Fidelity 500 Index Fund should appeal to any investors looking for a single core holding, and it lacks a minimum investment amount for all account types. The fund, however, has a comparatively brief performance history that could deter some who are more confident with a fund that’s been through multiple economic cycles.
Launched in 2011, it has an expense ratio of 0.015 %. The total Assets under management of this fund are $ 372 billion.
The below chart shows the fund’s performance (Purple) in comparison with the S&P 500 (Blue) and large blend (Red).
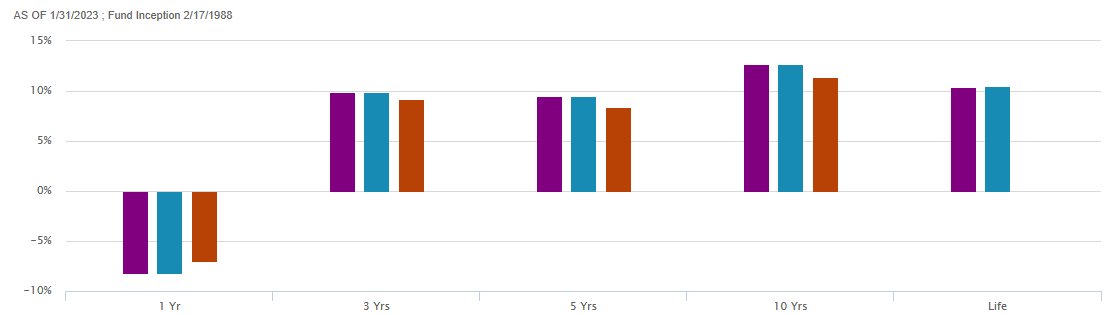
| 1 year | 3 years | 5 years | 10 years | Since Inception | |
| Fidelity 500 Index Fund | -8.23 % | 9.87 % | 9.53 % | 12.67 % | 10.42 % |
| S&P 500 | -8.22 % | 9.88 % | 9.54 % | 12.68 % | 10.55 % |
| Large Blend | -7.00 % | 9.18 % | 8.42 % | 11.41 % | — |
| Sr. | Sector | The weightage (%) |
| 1 | Information Technology | 25.69 % |
| 2 | Health Care | 15.79 % |
| 3 | Financials | 11.64 % |
| 4 | Consumer Discretionary | 9.78 % |
| 5 | Industrials | 8.64% |
| 6 | Communication Services | 7.26 % |
| 7 | Consumer Staples | 7.19 % |
| 8 | Energy | 5.22 % |
| 9 | Utilities | 3.18 % |
| 10 | Materials | 2.73 % |
| 11 | Real Estate | 2.7 % |
| 12 | Multi-Sector | 0.23 % |
| 13 | Other | 0 % |
Also read:


