Exchange Traded Funds are the easiest and safest investment to take advantage of the huge oil and gas sector all the while protecting your investment from the volatility of this sector. ETFs are a great addition to the investment portfolio. They offer a low-cost option to get exposure to the oil and gas sector.
To give investors an idea where to start and which companies to look for investment, we have compiled a list of top 10 ETFs to buy in 2024. Previously, we also covered best ETFs to buy in all categories. Below are one of the most pivotal investment products for investors because of their benefits and low risk.
| Sr. | ETF Name | Symbol | Total Assets ($000) | YTD (%) |
| 1. | United States Gasoline Fund | UGA | $106,551 | 33.12 |
| 2. | Invesco DB Oil Fund | DBO | $506,539 | 31.44 |
| 3. | iPath Pure Beta Crude Oil ETN | OIL | $53,432 | 30.66 |
| 4. | ProShares K-1 Free Crude Oil Strategy ETF | OILK | $84,100 | 30.15 |
| 5. | United States Brent Oil Fund | BNO | $334,130 | 30.12 |
| 6. | United States Oil Fund | USO | $2,986,690 | 29.48 |
| 7. | United States 12 Month Oil Fund | USL | $209,799 | 28.04 |
| 8. | Energy Select Sector SPDR Fund | XLE | $22,024,000 | >27.01 |
| 9. | RICI-Energy ETN | RJN | $3,343 | >26.07 |
| 10. | Invesco DB Energy Fund | DBE | $88,179 | 25.91 |
| 11. | Vanguard Energy ETF | VDE | $ 10,800 | -1.95 % |
| 12. | Alerian MLP ETF | AMLP | $ 6,510 | -4.22 % |
| 13. | SPDR S&P Oil & Gas Exploration & Production ETF | XOP | $ 3,700 | -2.19 % |
| 14. | iShares Oil & Gas Exploration & Production UCITS ETF | IOGP | $ 363,150 | -5.03% |
Read: Best stock signals and providers.
1. United States Gasoline Fund (UGA)
The United States Gasoline Fund is an exchange-traded security that is designed to track in percentage terms the movements of gasoline prices. United States Gasoline Fund offers the following three benefits to its investors:
- Offers commodity exposure without using a commodity futures account
- Provides options of intra-day pricing, and market, limit, and stop orders
- Also gives portfolio holdings, market price, NAV, and TNA on its website each day
This ETF was launched in 2008; it has an expense ratio of 0.75%.
UGA majorly invests in listed RBOB futures contacts and other gasoline futures contracts. These investments are collateralized by cash, cash equivalents, and US government obligations with remaining maturities of two years or less. Based on the nature of this fund, UGA is more towards offering a short-term tactical tilt towards a specific corner of the energy market.
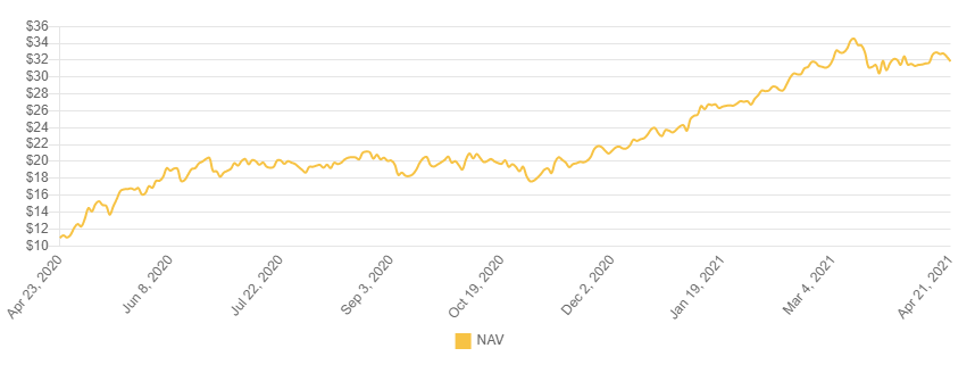
The below chart shows a detailed picture of the ETFs Net Asset Value historical trend since April 2020:
 The below chart shows the price trend of the UGA for the last two years:
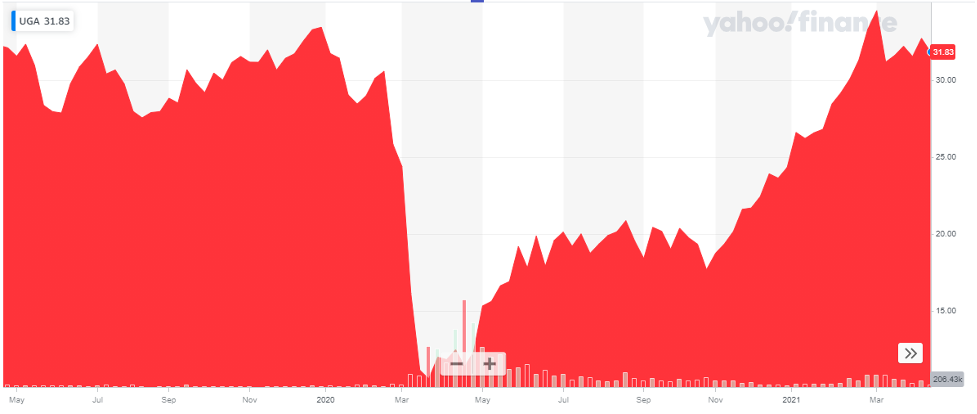 The ETF price took a massive blow, dropped more than 50% in value when Covid reached pandemic status. Since then, it has managed to rise back to the pre-covid level in the market.
Read:
2. Invesco DB Oil Fund (DBO)
Invesco BD Oil Fund provides exposure to light sweet crude oil (WTI), which is the most popular oil benchmark in the world. This ETF is designed for investors who want a cost-effective and convenient way to invest in commodity futures. DBO is not for every investor because of its high-risk nature. The investments are of speculative nature which takes place in a highly volatile environment.
Also check out: List of Most Volatile Stocks
The benefit DBO provides to its investors are:
- Enhanced Commodity Index – This fund follows a more sophisticated strategy than other commodity indexes
- Cost Savings – There is no cost of storing a physical commodity or the cost of entering into a commodity-linked note with a dealer
- Interest Earned – This fund collateralizes its futures contracts primarily with US Treasury securities, money market funds, and T-Bill ETFs and earns interest on these securities.
- Transparency and Liquidity – This fund invests in liquid futures contracts at publicly available prices determined by trading on regulated futures exchanges.
Also read: Best Stock Forecasts & Prediction Services
DBO was launched in 2007 and has an expense ratio of 0.75%.
The below chart shows the price trend of the DBO for the last two years:
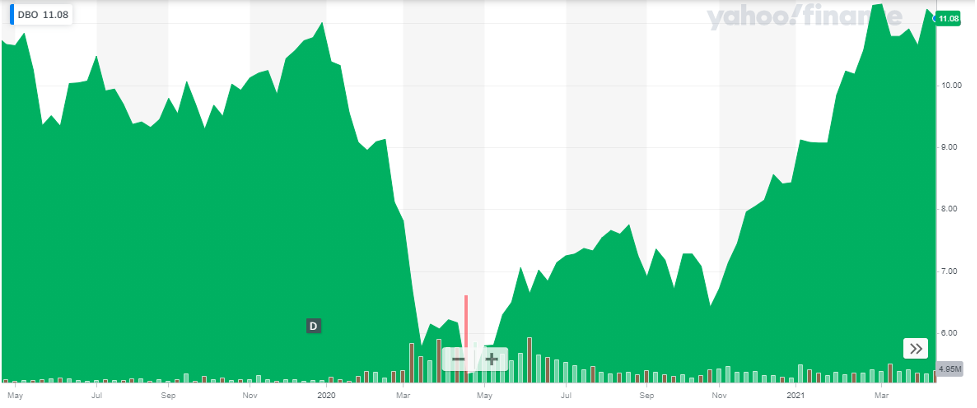 This ETF was hit pretty hard by the pandemic, as shown in the above chart. The index lost more than 50% of its value in March-20. DBO has managed to recover itself pretty well and has been able to reach the same value.
Also learn about Best Day Trading Stocks
3. iPath Pure Beta Crude Oil ETN (OIL)
This iPath Pure Beta Crude Oil ETN tracks crude oil. Crude oil is one of the most important resources in the world. This note tracks the S&P GSCI Crude Oil Total Return Index. This index reflects the returns that are available through an unleveraged investment in the West Texas Intermediate (WTI) crude oil futures contract.
This ETF was launched in 2011 and has an expense ratio of 0.75%. Just recently Barclays Bank announced that the expense ratio of OIL will be rescued to 0.57%. This is likely to attract more investors.
The below chart shows the price trend of the OIL for the last two years:
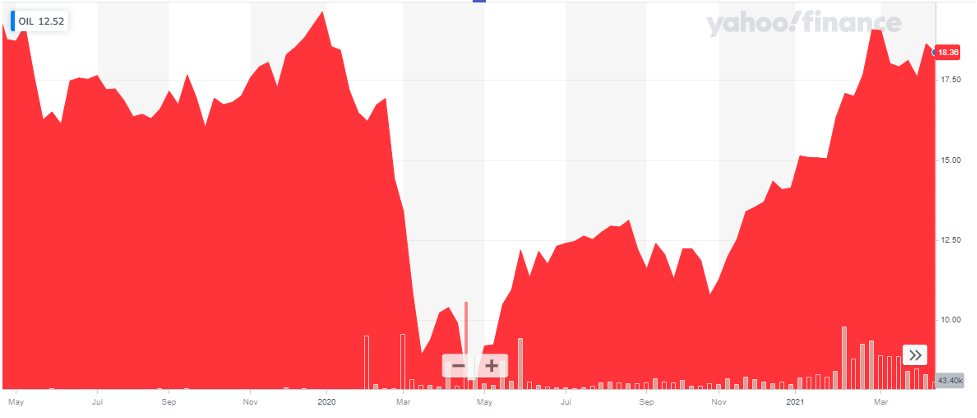 This ETF was a bit late in showing the effects of Covid but it did drop drastically. It dropped to $8.11 in May’20 (from $19.62 in January 2020). The index has now recovered and is currently trading at a price above $18. This amazing recovery makes this the best crude oil ETF to buy in 2023. Investing in best ETFs is one of the most easiest and safe investment option.
Also check out Best Forex Brokers for Trading
4. ProShares K-1 Free Crude Oil Strategy ETF (OILK)
ProShares K‑1 Free Crude Oil Strategy ETF tracks three separate contracts scheduled for West Texas Intermediate crude oil futures. This index offers the below to investors:
- Streamlined tax reports
- The fund’s benchmark is an index of crude oil futures contracts
- The spot price of WTI crude oil is not linked to the performance of this index
This ETF was launched in 2016 and has an expense ratio of 0.68%.
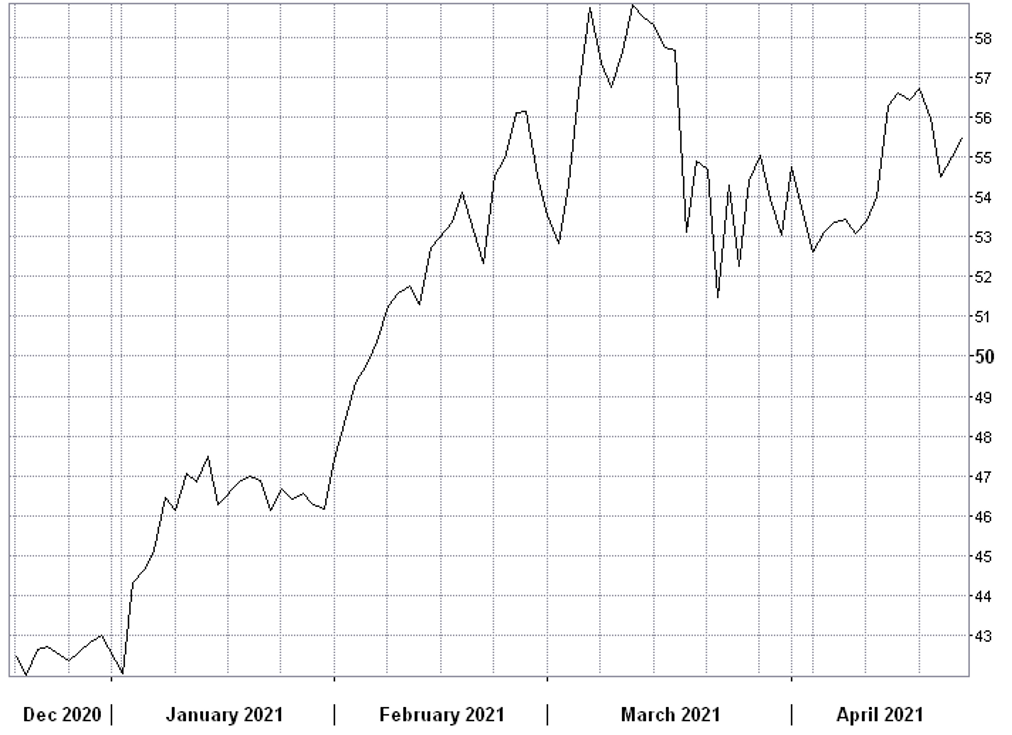
The below chart reflects the index performance from Dec-2020 till April 2021. The ETF is on an upward trend, in terms of return, in the past 6 months as reflected below:
 The below chart shows the price trend of the OILK for the last two years:
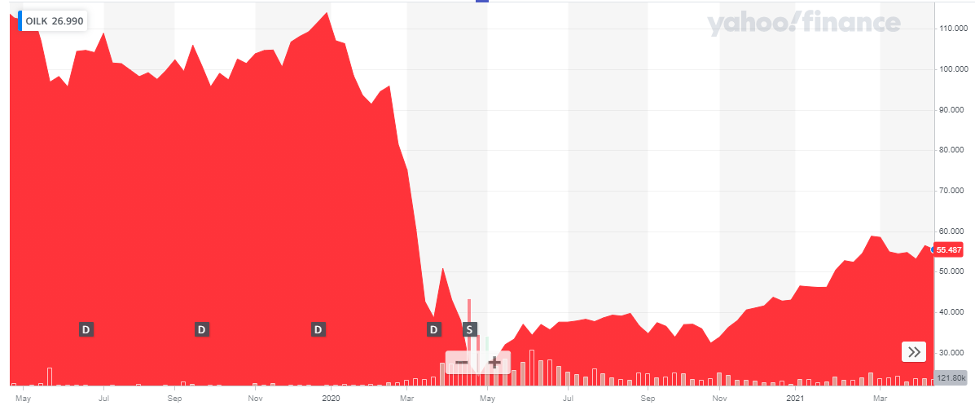 This index was also hit pretty hard during Covid. Since then, it is on the path to recovery and is progressing at a comparatively slow rate.
Also learn about Head and Shoulders Pattern – Trading Guide with Rules & Examples
5. United States Brent Oil Fund (BNO)
The United States Brent Oil Fund tracks Brent Crude Oil Brent Crude is the benchmark for the EMEA region and often trades at a different price than WTI. This index offers its investors:
- Exposure to commodities without a futures account
- Provides intra-day pricing, and market, limit, and stop orders
- Regularly updated portfolio holdings, market price, NAV, and TNA on its website each day
United States Brent Oil Fund was launched in 2010 and has an expense ratio of 0.9%.
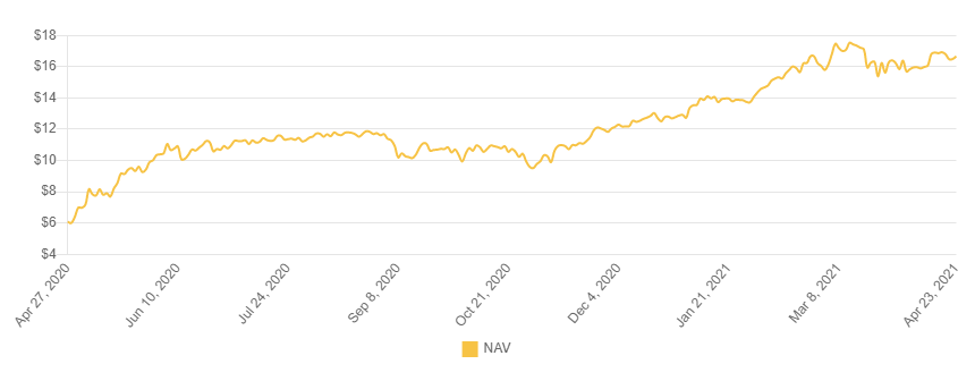
The below graph shows the Net Asset Value history of the index. The NAV of BNO has been continuously growing as reflected below:
 The below chart shows the price trend of the OILK for the last two years:
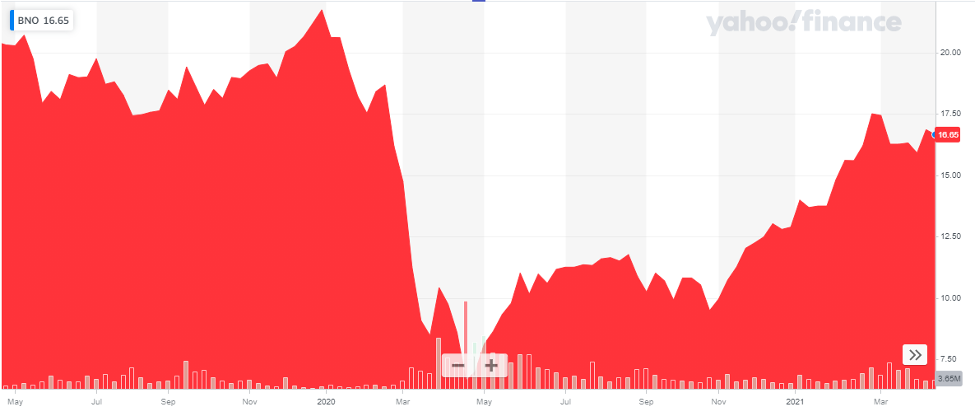 Like other ETFs, this index also took a huge dip in price when Covid-19 hit. After reaching the low level of $6.63, the index has been gradually improving and has reached beyond $16.
Also learn about Fibonacci Retracement, Extension & Trading Strategies
6. United States Oil Fund
This United States Oil Fund tracks the most important commodity, that is oil. It provides investors exposure to the oil market through crude oil futures contracts and other oil-related contracts. This fund is also a major attraction for investors as it acts as an inflation hedge.
The index has its own set of benefits which it provides to its investors:
- Regular updated intra-day pricing, and market, limit, and stop orders
- Regularly updated portfolio holdings, market price, NAV, and TNA on its website
- Also gives a forecasted portfolio based on market conditions and regulatory requirements
United States Oil Fund was launched in 2006 and has an expense ratio of 0.79%
The below chart shows the price trend of the USO for the last two years:
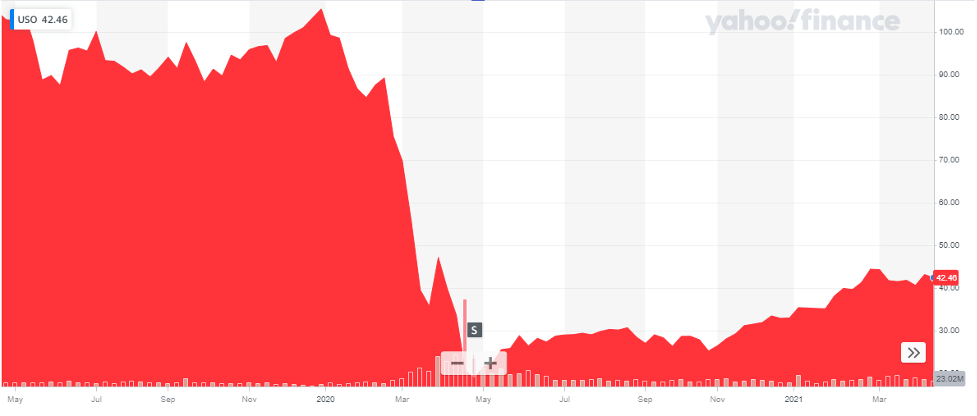 This index was also hit hard by the Covid. Due to complete lockdown, the supply of oil inflated while the demand dropped significantly. This led to a huge drop in the price of USO which tracks crude oil. The index is on the path to recovery and is performing better.
Read more:
7. The United States 12 Month Oil Fund (USL)
The United States 12 Month Oil Fund tracks the spot price of light, sweet crude oil delivered to Cushing, Oklahoma. The fund majorly invests in futures contracts for light, sweet crude oil, other types of crude oil, diesel-heating oil, gasoline, natural gas, and other petroleum-based fuels
This ETF was launched in 2007 and has an expense ratio of 0.88%.
The below chart shows the price trend of the USL for the last two years:
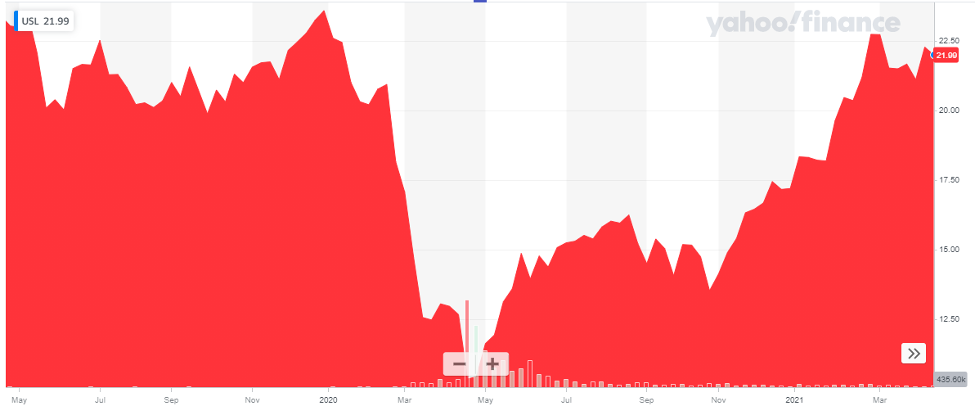 Like other oil ETFs, USL also was adversely affected by Covid-19 and the resultant lockdown. The reduction in the supply of oil had its impact on the price of the index which dropped more than 50%. After hitting the lowest mark of $10.35, the index has improved itself and has fully recovered the loss by March-2021.
Get to know the best covered call stocks to buy now.
8. Energy Select Sector SPDR Fund (XLE)
The Energy Select Sector SPDR is the oldest exchange-traded fund to focus on the energy business. This fund offers diversified exposure in the oil, coal, and natural gas industries. With over $22 Billion net assets, the fund is one of the largest ETFs. This fund offers its investors:
- Results that correlate with the price and yield performance of the Energy Select Sector Index
- Effectively reflects the energy sector of the S&P 500 Index
- Strategic or tactical positions that are more focusses as compared to additional ETFs investing decisions
The fund holding as of April 22, 2021, is as below:
| Sr. # | Name | Shares Held | Weightage |
| 1. | Exxon Mobil Corporation | 91,127,490 | 23.04% |
| 2. | Chevron Corporation | 48,051,904 | 22.19% |
| 3. | EOG Resources Inc. | 15,685,384 | 4.90% |
| 4. | Schlumberger NV | 37,583,410 | 4.34% |
| 5. | ConocoPhillips | 18,666,702 | 4.22% |
| 6. | Marathon Petroleum Corporation | 17,505,364 | 4.17% |
| 7. | Phillips 66 | 11,740,628 | 4.03% |
| 8. | Kinder Morgan Inc Class P | 52,328,850 | 3.92% |
| 9. | Pioneer Natural Resources Company | 5,530,403 | 3.70% |
| 10. | Williams Companies Inc. | 32,624,928 | 3.47% |
The index has invested in the major chunk of its portfolio in the biggest corporations of the sector as shown in the table above.
XLE was launched in 1988 and has a very low expense ratio of 0.12%. Such a huge portfolio of companies at a surprisingly low expense ratio makes XLE one of the best ETFs to buy for 2024. Renewable energy stocks have been very popular in the year 2020 and their popularity continues to increase in 2024.
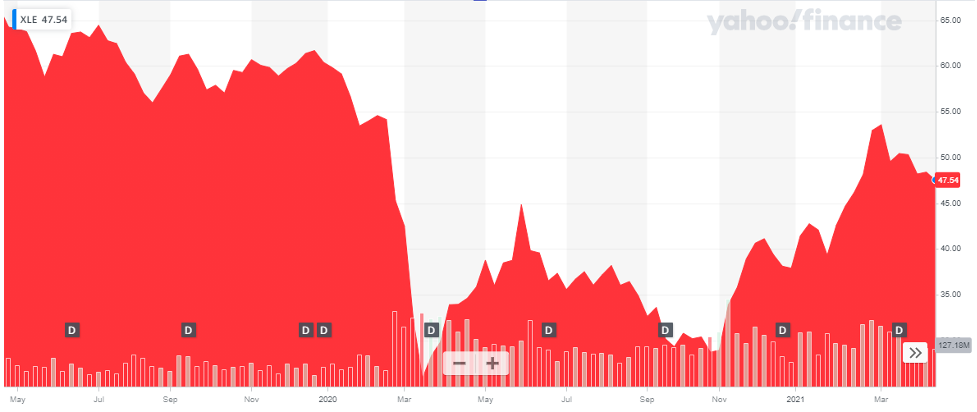
The below chart shows the price trend of the XLE for the last two years:
Read more:
9. ELEMENTS Rogers International Commodity Index Energy ETN- RJN
The ELEMENTS Rogers International Commodity Index Energy ETN is linked to the performance of the Rogers International Commodity Index -Energy Total Return. The index reflects the value of 6 energy commodity futures contracts. RJN is also a sub-index of the Rogers International Commodity Index-Total Return.
The index was launched in 2007 and has an expense ratio of 0.75%.
The below chart shows the price trend of the RJN for the last two years:
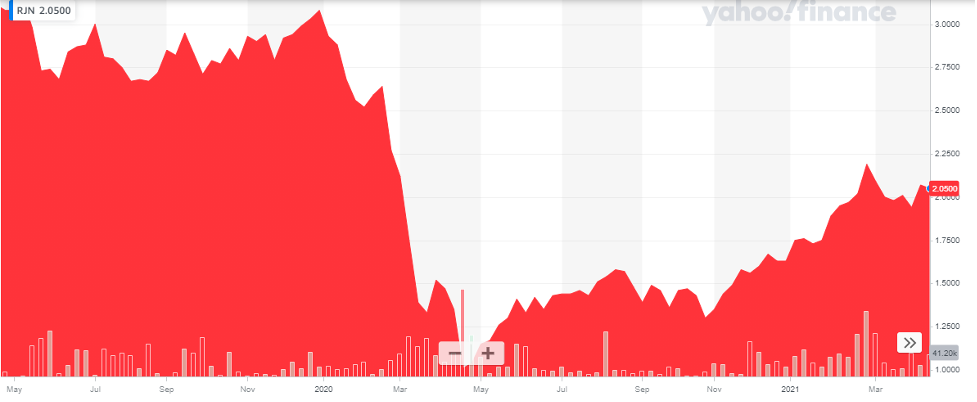 After a tremendous drop due to Covid-19, the index value is gradually improving.
Get to know about Best Trading and Forex Signal Providers
10. Invesco DB Energy Fund- DBE
The Invesco DB Energy Fund follows the DBIQ Optimum Yield Energy Index Excess ReturnTM (DBIQ Opt Yield Energy Index ER or Index. This fund is for those investors who want to invest cost-effectively and conveniently in commodity futures. The Index is a rules-based index composed of futures contracts on some of the most heavily traded energy commodities in the world – light sweet crude oil (WTI), heating oil, Brent crude oil, RBOB gasoline, and natural gas.
This ETF was launched in 2007 and has an expense ratio of 0.75%.
The top holdings of DBE as of March 31, 2021, are as below:
| Sr. # | Futures | Weightage (%) |
| 1. | WTI Crude | 24.15 |
| 2. | Gasoline | 23.92 |
| 3. | NY Harbor ULSD | 23.09 |
| 4. | Brent Crude | 21.95 |
| 5. | Natural Gas | 6.89 |
The below chart shows the price trend of the DBE for the last two years:
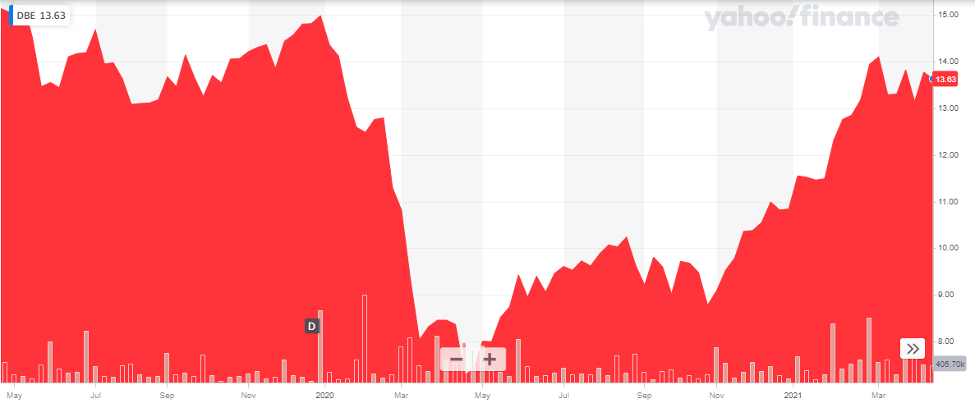 After a huge drop because of Covid-19, the index has shown remarkable recovery and has almost reached the pre-Covid valuation.
VANGUARD ENERGY ETF (NYSEMKT: VDE)
The Vanguard Energy ETF is a broad-based fund providing investors with exposure to companies involved in producing energy products such as oil, natural gas, and coal.
Vanguard Energy ETF seeks to track the investment performance of the MSCI US Investable Market Energy 25/50 Index, a benchmark of large-, mid-, and small-cap U.S. stocks in the energy sector, as classified under the Global Industry Classification Standard (GICS). This GICS sector is made up of companies whose businesses are dominated by either of the following activities:
- The construction or provision of oil rigs, drilling equipment, and other energy-related service and equipment (such as seismic data collection)
- The companies engaged in the exploration, production, marketing, refining, and/or transportation of oil and gas products.
Whenever possible, the fund attempts to fully replicate the target index, holding each stock in approximately the same proportion as its weighting in the index. However, the fund will use a sampling strategy if regulatory constraints or other considerations prevent it from replicating the index. Vanguard’s Equity Index Group uses proprietary software to implement trading decisions that accommodate cash flows and maintain close correlation with index characteristics. Vanguard’s refined indexing process, combined with low management fees and efficient trading, has provided a tight tracking net of expenses.
This ETF was launched in 2004; it has an expense ratio of 0.10 %.
The below chart shows a detailed picture of the ETF’s Net Asset Value historical trend over the past three years:
The fund has invested more than 50 % of its portfolio in the top oil companies which include:
- Exxon Mobil Corp
- Chevron Corp.
- ConocoPhillips
- Schlumberger Ltd.
- EOG Resources Inc.
Alerian MLP ETF (NYSEMKT: AMLP)
The Alerian MLP ETF (AMLP) seeks investment results that correspond (before fees and expenses) generally to the price and yield performance of its underlying index, the Alerian MLP Infrastructure Index (AMZI).
The Alerian MLP ETF (AMLP) delivers exposure to the Alerian MLP Infrastructure Index (AMZI), a capped, float-adjusted, capitalization-weighted composite of energy infrastructure Master Limited Partnerships (MLPs) that earn the majority of their cash flow from midstream activities.
This ETF was launched in 2010; it has an expense ratio of 0.87 %.
The below chart shows the price performance of the ETF for the past year.
The fund has invested more than 50 % of its portfolio in the top oil companies which include:
- PAA -Plains All American Pipeline LP
- ET -Energy Transfer LP
- MPLX -MPLX LP
- EPD – Enterprise Products Partners LP
- MMP – Magellan Midstream Partners LP
SPDR S&P Oil & Gas Exploration & Production ETF (NYSEMKT: XOP)
The SPDR S&P Oil & Gas Exploration & Production ETF seeks to provide investment results that, before fees and expenses, correspond generally to the total return performance of the S&P Oil & Gas Exploration & Production Select Industry® Index (the “Index”),
This ETF seeks to provide exposure to the oil and gas exploration and production segment of the S&P TMI, which comprises the following sub-industries:
- Integrated Oil & Gas
- Oil & Gas Exploration & Production
- Oil & Gas Refining & Marketing
This fund seeks to track a modified equal-weighted index that provides the potential for unconcentrated industry exposure across large, mid, and small-cap stocks. It also allows investors to take strategic or tactical positions at a more targeted level than traditional sector-based investing.
This ETF was launched in 2006; it has an expense ratio of 0.35 %.
The below chart shows the historical performance of the ETF:
The fund has invested approx. 25 % of its portfolio in the top oil companies which include:
- PBF Energy Inc. Class A
- Permian Resources Corporation Class A
- Kosmos Energy Ltd
- Civitas Resources Inc.
- Marathon Petroleum Corp
- Valero Energy Corp
- Callon Petroleum Company
- PDC Energy Inc
- Diamond Energy Inc.
- Range Resources Corp.
iShares Oil & Gas Exploration & Production UCITS ETF (IOGP)
The iShares Oil & Gas Exploration & Production UCITS ETF seeks to track the S&P Commodity Producers Oil & Gas Exploration & Production index. The S&P Commodity Producers Oil & Gas Exploration & Production index tracks the largest publicly-traded companies involved in the exploration and production of oil and gas from around the world.
This ETF was launched in 2011; it has an expense ratio of 0.55 %.
The below chart shows the performance of the ETF for the past three years:
The fund has invested more than 40 % of its portfolio in the top oil companies which include:
- EOG Resources
- ConocoPhillips
- Canadian Natural Resources Ltd.
- Pioneer Natural Resources Co
- Woodside Energy Group Ltd.
Disclaimer: None of the information published in this article should be construed as investment advice. Article is based on author’s independent research, we strongly advise our readers to always do their due diligence before investing.
You may also like reading:
- Best Penny Stocks to Invest in
- Best Stock & Forex Trading Courses Online
- Best Drone Stocks to Invest in
- Bonds vs Stocks – Where to Invest
- Best Crypto Currencies To Invest
- Best Renewable Energy Stocks to Invest
- Monthly Dividend Stocks to Buy

