

Elliott Wave Theory is one of the most powerful tools for understanding market structure. It helps traders study trends, corrections, market psychology, and potential turning points. But no trader should rely on one method alone.
Markets are complex. Price does not move in a straight line, and traders need more than one lens to understand what is happening on the chart. That is where common chart patterns become useful. Chart patterns are visual formations created by price movement over time. They help traders identify potential breakouts, reversals, trend continuation setups, and areas where buyers or sellers may be gaining control. While Elliott Wave analysis focuses on wave structure and market cycles, chart patterns can provide a simpler way to confirm what price may be doing.
For example, an Elliott Wave trader may identify a corrective structure. At the same time, a triangle or flag pattern may appear on the chart. When both methods point toward the same market direction, the setup may become easier to understand.
In this guide, we will explore the most common chart patterns beyond Elliott Wave, how they work, and how traders can use them with better risk management.
What Are Chart Patterns?
Chart patterns are repeated price formations that appear on trading charts. They are created by the battle between buyers and sellers. When price moves, pauses, reverses, or consolidates, it often creates recognizable shapes. These shapes can help traders understand whether the market is likely to continue in the same direction or prepare for a reversal.
Common chart patterns include:
- Head and shoulders
- Double tops and double bottoms
- Triangles
- Flags and pennants
- Wedges
- Rectangles
- Cup and handle patterns
- Rounding bottoms
These patterns are used across stocks, forex, commodities, indices, cryptocurrencies, and ETFs.
Why Look Beyond Elliott Wave?
Elliott Wave Theory is excellent for understanding market cycles, but it can be subjective. Two traders may look at the same chart and create different wave counts. Chart patterns can help add another layer of confirmation.
For example:
- A bullish Elliott Wave count may become stronger if price also forms a breakout pattern.
- A corrective wave may become clearer if it develops inside a triangle.
- A potential reversal may gain more attention if it forms a head and shoulders pattern.
- A continuation wave may become easier to trade if it appears with a flag or pennant.
This does not mean chart patterns are always correct. No pattern works 100% of the time. But when combined with trend analysis, volume, support and resistance, Fibonacci levels, and proper risk management, they can help traders make better decisions.
Elliott Wave vs Chart Patterns
Elliott Wave and chart patterns are not competing methods. They can work together.
| Feature | Elliott Wave Theory | Chart Patterns |
|---|---|---|
| Main Focus | Market cycles and wave structure | Visual price formations |
| Best Used For | Trend analysis, corrections, market psychology | Breakouts, reversals, continuation setups |
| Difficulty Level | Intermediate to advanced | Beginner to intermediate |
| Confirmation Style | Wave counts and Fibonacci ratios | Breakout levels, neckline, trendlines, volume |
| Main Risk | Subjective wave counts | False breakouts |
Elliott Wave theory gives traders a bigger market roadmap. Chart patterns help traders identify visible setups that may confirm the next move.
Types of Chart Patterns
Most chart patterns fall into three major groups:
1. Reversal Patterns
Reversal patterns suggest that the current trend may be losing strength and price could move in the opposite direction.
Examples include:
- Head and shoulders
- Inverse head and shoulders
- Double top
- Double bottom
- Rounding top
- Rounding bottom
2. Continuation Patterns
Continuation patterns suggest that price may pause before continuing in the same direction.
Examples include:
- Bull flags
- Bear flags
- Pennants
- Rectangles
- Ascending triangles
- Descending triangles
3. Bilateral Patterns
Bilateral patterns can break in either direction. Traders usually wait for confirmation before entering.
Examples include:
- Symmetrical triangles
- Broadening formations
- Some wedge patterns
The key is not to predict too early. The pattern is only useful when price confirms the breakout or breakdown.
To strengthen your chart analysis, use Elliott Wave tools and indicators alongside common chart patterns for better confirmation and trade planning.
Common Chart Patterns Every Trader Should Know
1. Head and Shoulders Pattern
The head and shoulders pattern is one of the most popular reversal patterns in technical analysis. It usually appears after an uptrend and signals that buyers may be losing control. The pattern has three peaks:
- Left shoulder
- Head
- Right shoulder
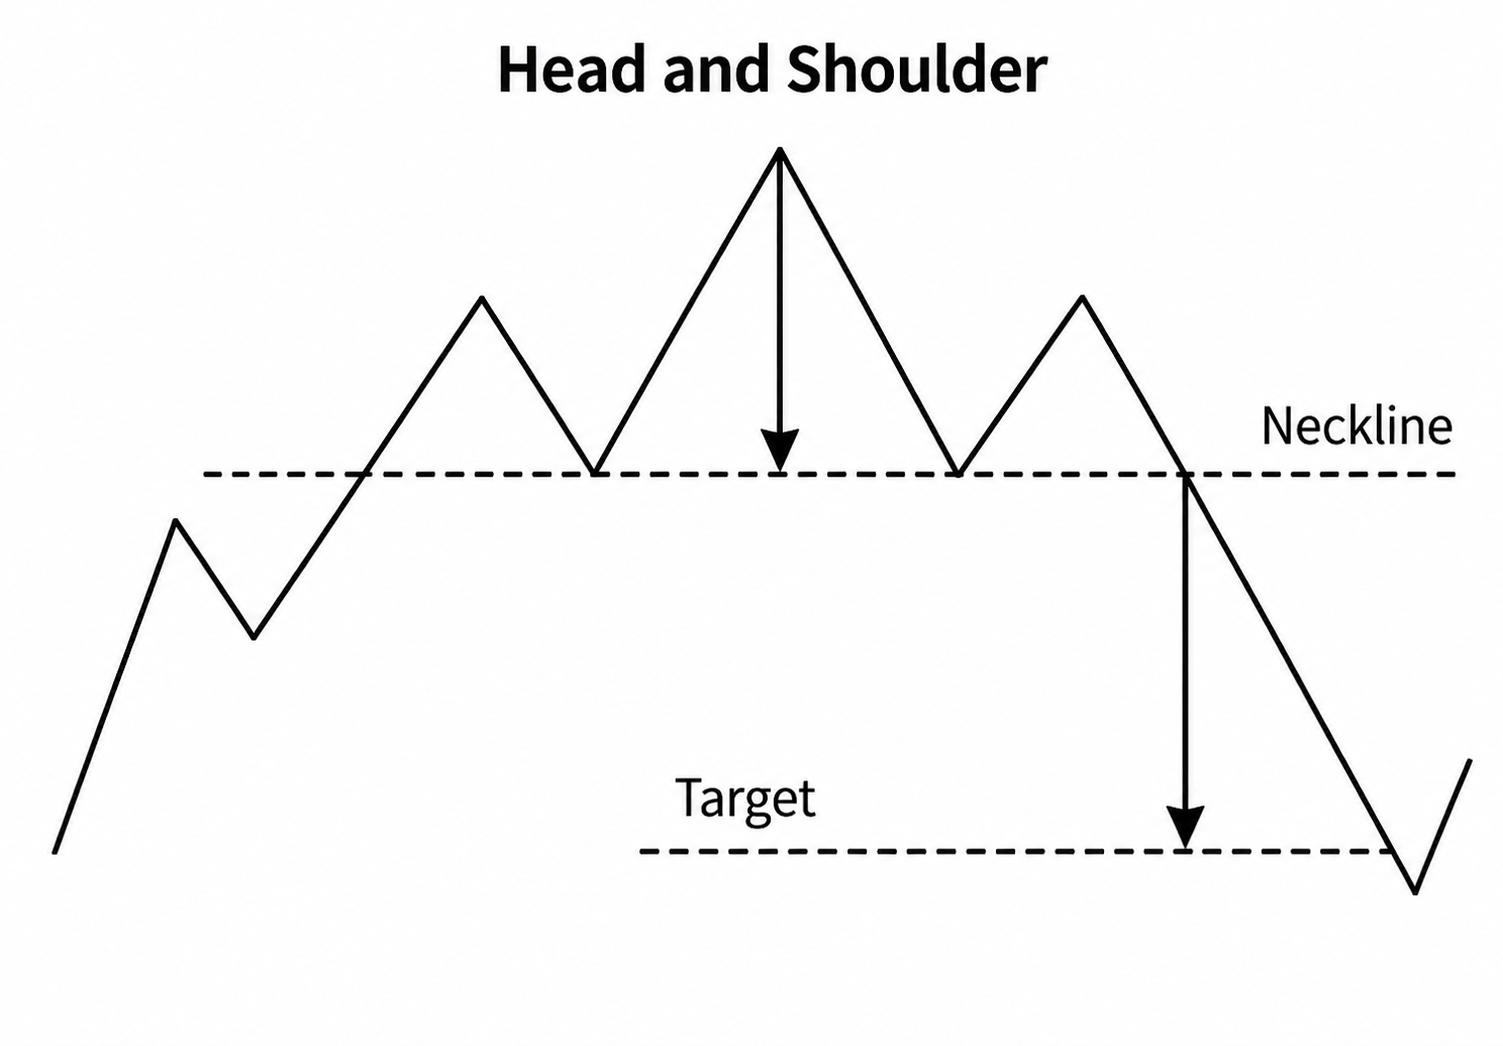
The head is the highest peak. The two shoulders are lower peaks on both sides. A neckline connects the support area below the pattern. A bearish signal appears when price breaks below the neckline.
How traders use it
Traders often watch for a clear uptrend before the pattern forms, followed by three visible peaks that create the left shoulder, head, and right shoulder. The pattern becomes more important when price breaks below the neckline, especially if the move happens with increased volume. In many cases, traders also look for a retest of the neckline as resistance before considering the breakdown more reliable.
Example
Suppose a stock rallies from $50 to $70, pulls back to $62, then rallies again to $80. After that, it pulls back and makes one more lower high near $72. If price breaks below the support area around $62, traders may see it as a head and shoulders breakdown. This pattern can also appear in reverse. The inverse head and shoulders pattern often forms after a downtrend and may signal a bullish reversal.
2. Double Top Pattern
A double top is a bearish reversal pattern that forms when price tests the same resistance area twice and fails to break higher. It looks like the letter “M.” The pattern shows that buyers tried twice to push price above resistance but could not maintain momentum.
How traders use it
A double top is not confirmed just because price touches resistance twice. Traders usually wait for price to break below the support level between the two peaks. This support level is often called the neckline.
Key signs of a stronger double top
- Price forms after a strong uptrend
- Second peak fails to make a strong breakout
- Momentum weakens
- Volume declines near the second peak
- Price breaks below neckline support
A double top can warn traders that the trend may be shifting from bullish to bearish.
Before trading any chart setup, review the Major Assumptions of Technical Analysis to understand why price action, trends, and market psychology matter.
3. Double Bottom Pattern
A double bottom is the opposite of a double top. It is a bullish reversal pattern that appears after a downtrend. It looks like the letter “W.” The pattern forms when price tests the same support area twice and buyers step in both times.
How traders use it
Traders usually wait for price to break above the resistance area between the two lows. This breakout confirms that buyers may be gaining control.
Example
If silver drops from $32 to $28, bounces to $30, then falls again near $28 but fails to break lower, traders may watch the $30 level. If price breaks above $30 with strength, the double bottom may confirm a bullish reversal. Double bottoms can be useful in stocks, commodities, forex pairs, and cryptocurrencies.
4. Triangle Patterns
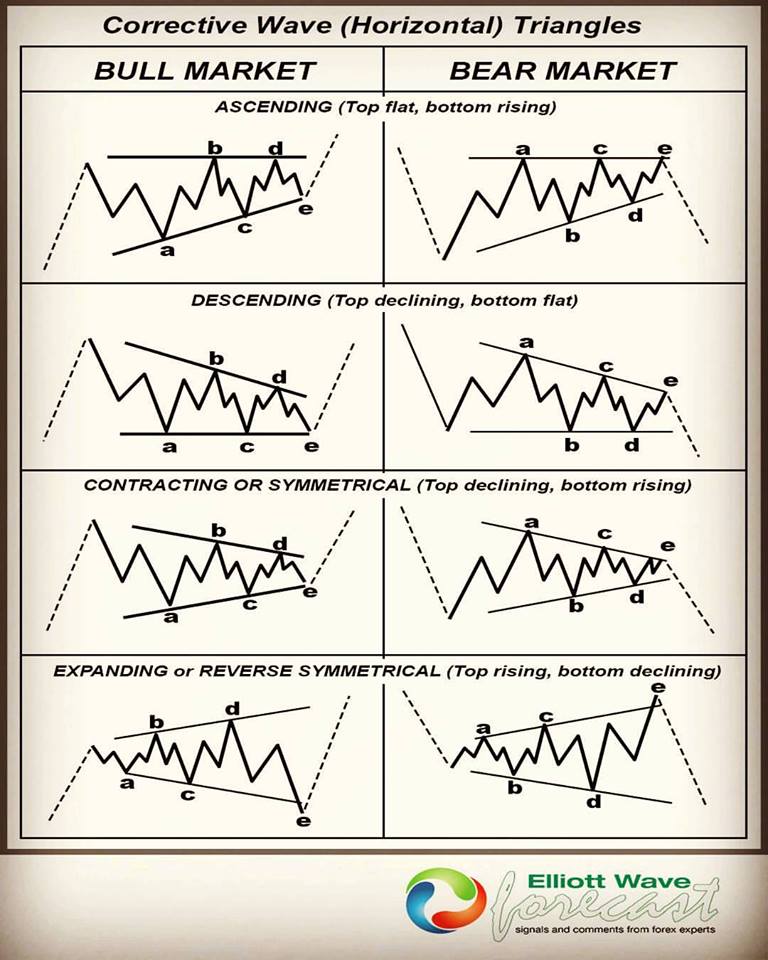
Triangle patterns are common consolidation patterns. They show that price is compressing between support and resistance.
There are three main types:
- Ascending triangle
- Descending triangle
- Symmetrical triangle
Ascending Triangle
An ascending triangle has a flat resistance line and rising support. It often suggests that buyers are becoming more aggressive. A bullish breakout may occur when price breaks above resistance.
Descending Triangle
A descending triangle has flat support and falling resistance. It often suggests that sellers are becoming more aggressive. A bearish breakdown may occur when price breaks below support.
Symmetrical Triangle
A symmetrical triangle structure forms when price makes lower highs and higher lows. It shows market compression. This pattern can break either upward or downward, so traders usually wait for confirmation.
How triangles connect with Elliott Wave
Triangles often appear during corrective phases in Elliott Wave analysis. They may form before the final move of a larger wave structure. That is why Elliott Wave traders often pay close attention to triangle patterns. A triangle may indicate that the market is preparing for a breakout once the correction is complete.
5. Flag Patterns
Flags are continuation patterns that appear after a strong price move. A bullish flag forms after a sharp move upward. Price then moves sideways or slightly downward in a tight channel before continuing higher. A bearish flag forms after a sharp decline. Price then moves sideways or slightly upward before continuing lower. Flags help traders avoid chasing the first big move. Instead, they can wait for a controlled pullback and look for continuation.
Bull flag example
A stock jumps from $100 to $115, then pulls back slowly to $110 while staying inside a narrow channel. If price breaks above the channel, traders may see it as a bullish continuation signal.
Bear flag example
A currency pair drops sharply, then consolidates in a small upward channel. If price breaks below that channel, traders may see it as a bearish continuation signal. This trading pattern work best when they form after strong momentum and break in the direction of the original trend.
6. Pennant Patterns
Pennants are similar to flags, but they look more like small triangles. They form after a strong price move, followed by a short period of consolidation. The price range becomes tighter before a breakout.

Bullish pennant
A bullish pennant appears after a strong rally. Price consolidates in a small triangle, then may break higher.
Bearish pennant
A bearish pennant appears after a strong decline. Price consolidates in a small triangle, then may break lower. Pennants are usually short-term patterns. They are often used by active traders looking for continuation setups.
7. Wedge Patterns
Wedges form when price moves between two narrowing trendlines. There are two main types:
- Rising wedge
- Falling wedge
Rising Wedge
A rising wedge forms when price moves higher, but the price range becomes narrower. This can signal weakening momentum. A rising wedge often has bearish implications, especially when it appears after an uptrend.
Falling Wedge
A falling wedge forms when price moves lower, but the range becomes narrower. This can signal selling pressure is weakening. A falling wedge often has bullish implications, especially when it appears after a downtrend.
Wedges can be tricky. They can sometimes act as continuation patterns depending on where they appear in the broader trend. Always use confirmation before trading them.
8. Rectangle Pattern
A rectangle pattern forms when price moves sideways between support and resistance. It shows balance between buyers and sellers. The market is not trending strongly. Instead, it is building pressure inside a range.
How traders use rectangles
Traders may use rectangles in two ways:
- Range trading: Buying near support and selling near resistance
- Breakout trading: Waiting for price to break above resistance or below support
A rectangle breakout can lead to a strong move if price has been consolidating for a long time. Learn how labeling wave patterns can help traders organize Elliott Wave counts and compare them with common chart patterns for stronger market structure analysis.
9. Cup and Handle Pattern
The cup and handle is a bullish continuation pattern. It looks like a rounded bottom followed by a small pullback. The rounded bottom forms the “cup,” and the smaller pullback forms the “handle.” The pattern suggests that price went through a correction, recovered gradually, and then paused before attempting a breakout.
How traders use it
Traders often look for:
- A rounded base
- A small handle pullback
- A breakout above resistance
- Strong volume on the breakout
Cup and handle patterns are often seen in stocks during longer-term uptrends.
10. Rounding Bottom Pattern
A rounding bottom is a longer-term bullish reversal pattern. It forms when price slowly shifts from a downtrend into an uptrend. Instead of a sharp V-shaped recovery, the market gradually builds support. This pattern can show that sellers are losing control and buyers are slowly accumulating. It may take weeks or months to form, especially on daily or weekly charts.
How to Confirm Chart Patterns
A chart pattern alone is not enough, so traders should look for confirmation before entering a trade.
- Wait for the breakout: A pattern is only confirmed when price breaks the key level, such as a triangle trendline or a head and shoulders neckline.
- Check volume: Rising volume on a breakout can support the move, while weak volume may signal a false breakout.
- Use support and resistance: Key levels such as necklines, trendlines, range highs, and range lows help traders plan entries, stops, and targets.
- Combine with Fibonacci levels: Fibonacci retracements can highlight possible pullback zones, while extensions can help estimate potential targets.
- Use Elliott Wave as the bigger roadmap: Chart patterns can help with timing, while Elliott Wave analysis can provide broader market structure and trend context.
Common Mistakes Traders Make With Chart Patterns
Mistake 1: Seeing Patterns Everywhere
Not every price movement is a pattern. Sometimes the market is messy, choppy, and unclear. Traders should avoid forcing a pattern just because they want a trade. Clean patterns are usually easier to identify. If the setup requires too much imagination, it may not be worth trading.
Mistake 2: Entering Before Confirmation
Many traders enter too early because they want the best price. The problem is that patterns can fail before they confirm. A triangle may break down instead of up. A double bottom may turn into a new low. A head and shoulders pattern may never break the neckline. Confirmation is important. Use Elliott Wave channeling and trendlines to connect wave structure with chart patterns and identify cleaner support, resistance, and breakout levels.
Mistake 3: Ignoring the Bigger Trend
A bullish pattern in a strong downtrend may fail quickly. A bearish pattern in a strong uptrend may also fail. Always check the larger trend before trading a pattern. Use multiple timeframes:
- Weekly chart for the major trend
- Daily chart for structure
- 4-hour or 1-hour chart for timing
Mistake 4: Forgetting Risk Management
Even the best chart pattern can fail. That is why every trade needs a stop-loss, position size, and exit plan. A trader should know the risk before entering the trade, not after the market moves against them.
For better trade protection, review our guide on Stop Loss Trading Strategies.
Mistake 5: Trading Every Breakout
Breakouts can fail. This is common in volatile markets. A false breakout happens when price moves beyond a key level but quickly reverses. To reduce this risk, traders may wait for:
- A candle close beyond the level
- Strong volume
- Retest of the breakout zone
- Confirmation from another indicator
- Alignment with the larger trend
Practical Chart Pattern Trading Checklist
Before trading a chart pattern, ask these questions:
- Is the pattern clear and easy to identify?
- Does it appear in the right market context?
- Is the larger trend supportive?
- Has price confirmed the breakout or breakdown?
- Is volume supporting the move?
- Where is the invalidation level?
- Is the risk-to-reward ratio reasonable?
- Does the setup align with Elliott Wave structure?
- Is there major news or earnings risk nearby?
- Is the position size controlled?
This checklist can help traders avoid emotional decisions.
How Elliott Wave Forecast Helps Traders
At Elliott Wave Forecast, we help traders study market direction using Elliott Wave analysis, technical analysis, Fibonacci levels, support and resistance, and price structure. Chart patterns can add another layer of confirmation, but they should not be used in isolation. By combining pattern recognition with Elliott Wave analysis, traders may better understand whether a market is trending, correcting, breaking out, or preparing for a reversal.
Our analysis covers multiple markets, including stocks, forex, commodities, indices, ETFs, and cryptocurrencies. Traders can use this broader view to compare setups across different asset classes and identify cleaner opportunities.

FAQs
What is the most reliable chart pattern?
No chart pattern is reliable all the time. However, patterns such as head and shoulders, double bottoms, triangles, and flags are widely used because they show clear support, resistance, and breakout levels.
Are chart patterns better than Elliott Wave?
Chart patterns are not necessarily better than Elliott Wave. They are different tools. Elliott Wave helps traders understand market cycles, while chart patterns help identify visible breakout, reversal, and continuation setups.
Can beginners use chart patterns?
Yes. Chart patterns are one of the easiest ways for beginners to start learning technical analysis. Patterns like double tops, double bottoms, flags, and triangles are simple to recognize with practice.
Do chart patterns work in forex and crypto?
Yes, chart patterns can appear in forex, crypto, stocks, commodities, and indices. However, crypto and forex markets can be highly volatile, so confirmation and risk management are important.
Should I trade a chart pattern before breakout confirmation?
It is usually safer to wait for confirmation. Entering before confirmation may provide a better price, but it also increases the risk of being wrong early.
How do I avoid false breakouts?
You can reduce false-breakout risk by waiting for a candle close beyond the breakout level, checking volume, using multiple timeframes, and watching for a retest of the breakout zone.
Can chart patterns be combined with Fibonacci?
Yes. Fibonacci retracement and extension levels can help identify pullback zones, breakout targets, and potential support or resistance areas around chart patterns.
Why do chart patterns fail?
Chart patterns fail because market conditions change. News, low volume, strong opposing trends, liquidity events, and false breakouts can all cause a pattern to fail.
Final Thoughts
Elliott Wave Theory gives traders a valuable framework for understanding market cycles, but chart patterns can make price action easier to read.
Patterns like triangles, flags, wedges, head and shoulders, double tops, and double bottoms help traders identify potential breakouts, reversals, and continuation setups. They are not perfect, but they can be useful when combined with Elliott Wave analysis, support and resistance, Fibonacci levels, volume, and risk management. The goal is not to memorize every pattern. The goal is to understand what each pattern says about buyers, sellers, momentum, and market psychology.
A clean chart pattern, supported by the bigger trend and managed with proper risk, can help traders make more disciplined decisions in any market.




