

Beyond technical characteristics, Elliott Wave analysts also study the personality of each individual wave, as it reflects the psychology and market sentiment behind price movements. In the chart below, you can see an example of a rising trend represented by a 5-wave impulsive structure.
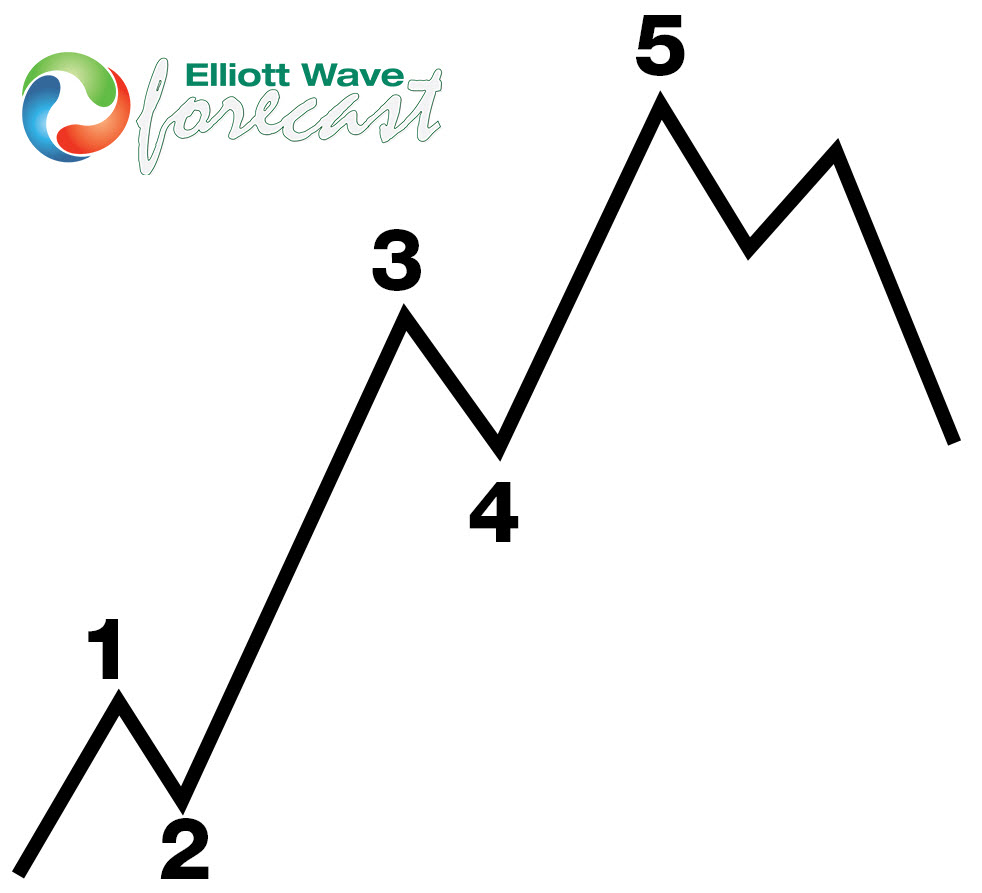
- Wave 1 is rarely obvious at its inception . Traders believe previous trend is still strongly in force and it’s usually considered as correction. Volume might increase a bit as move progressing, but not by enough to alert many technical analysts. Occasionally it could take structure of leading diagonal.
- Wave 2 corrects wave one and it could never extend beyond the start point of wave 1. In most cases it do not retrace more than 61.8 % or 76.4% of wave 1. It usually takes form of Zig Zag, Flat or Double Three and it could never be a Triangle. Volume should be lower during Wave 2 than during wave 1.
- Wave 3 is usually the largest and most powerful wave in a trend. Price is progressing quickly, corrections are short –lived and shallow. By wave 3 midpoint the crowd will often join the new trend. Wave 3 must exceed at leas 1.618 fib extension of wave 1 and could go up to 2.618 fib ext or more. Wave 3 cannot be the shortest one.
- Wave 4 is typically clearly corrective. Price could do sideways for an extended period and typically retraces less than 38.2 %, usually 23.6% of wave 3. Fourth waves are often frustrating because of their lack of progress in the larger trend. Wave 4 does not overlap with the price territory of wave 1, except in the case of a diagonal. It often takes structure of flat, triangle or irregular correction. At Elliottwave-Forecast.com, we don’t label a wave 4 if it passes 50% Fibonacci retracement of wave 3 (unless a diagonal)
- Wave 5 is the final leg in the direction of the dominant trend. The news is almost universally positive and everyone is bullish. Unfortunately, this is when many average investors finally buy in, right before the top. Volume is lower in wave five than in wave three, and many momentum indicators start to show divergences. It often takes form of ending diagonal structure.
Imagine Trading With A Clear Plan Every Day.
Imagine opening your charts knowing exactly what you’re waiting for.
No chasing.
No guessing.
No emotional decisions.
Just a structured trading plan built on professional Elliott Wave analysis.
That’s exactly what thousands of Elliott Wave Forecast members experience every day.
Our analysts continuously monitor 78 markets, identifying high-probability opportunities while providing the education and guidance that help traders become more consistent over time.
Inside your membership you’ll gain access to:
✓ Daily Elliott Wave Market Analysis
✓ Official Trading Recommendations
✓ Live Trading Room
✓ Unlimited Questions During Trading Hours
✓ Professional Market Coverage Across Forex, Stocks, ETFs, Commodities & Crypto
✓ Entry, Stop Loss & Take Profit Levels
The market will always create new opportunities.
The question is whether you’ll be prepared when they arrive.
Experience Elliott Wave Forecast risk-free for 14 days for only $9.99.
Your next great trading decision could begin today.
👉 Start Your 14-Day Trial Today
Offer Expires Soon!
Get full access to real-time Signals, Live Sessions, 24 Hour Chat Room Support and Expert Analysis — all for only $0.99 during your 14-day trial.
⏳ This limited-time price will expire soon — don’t miss out!


