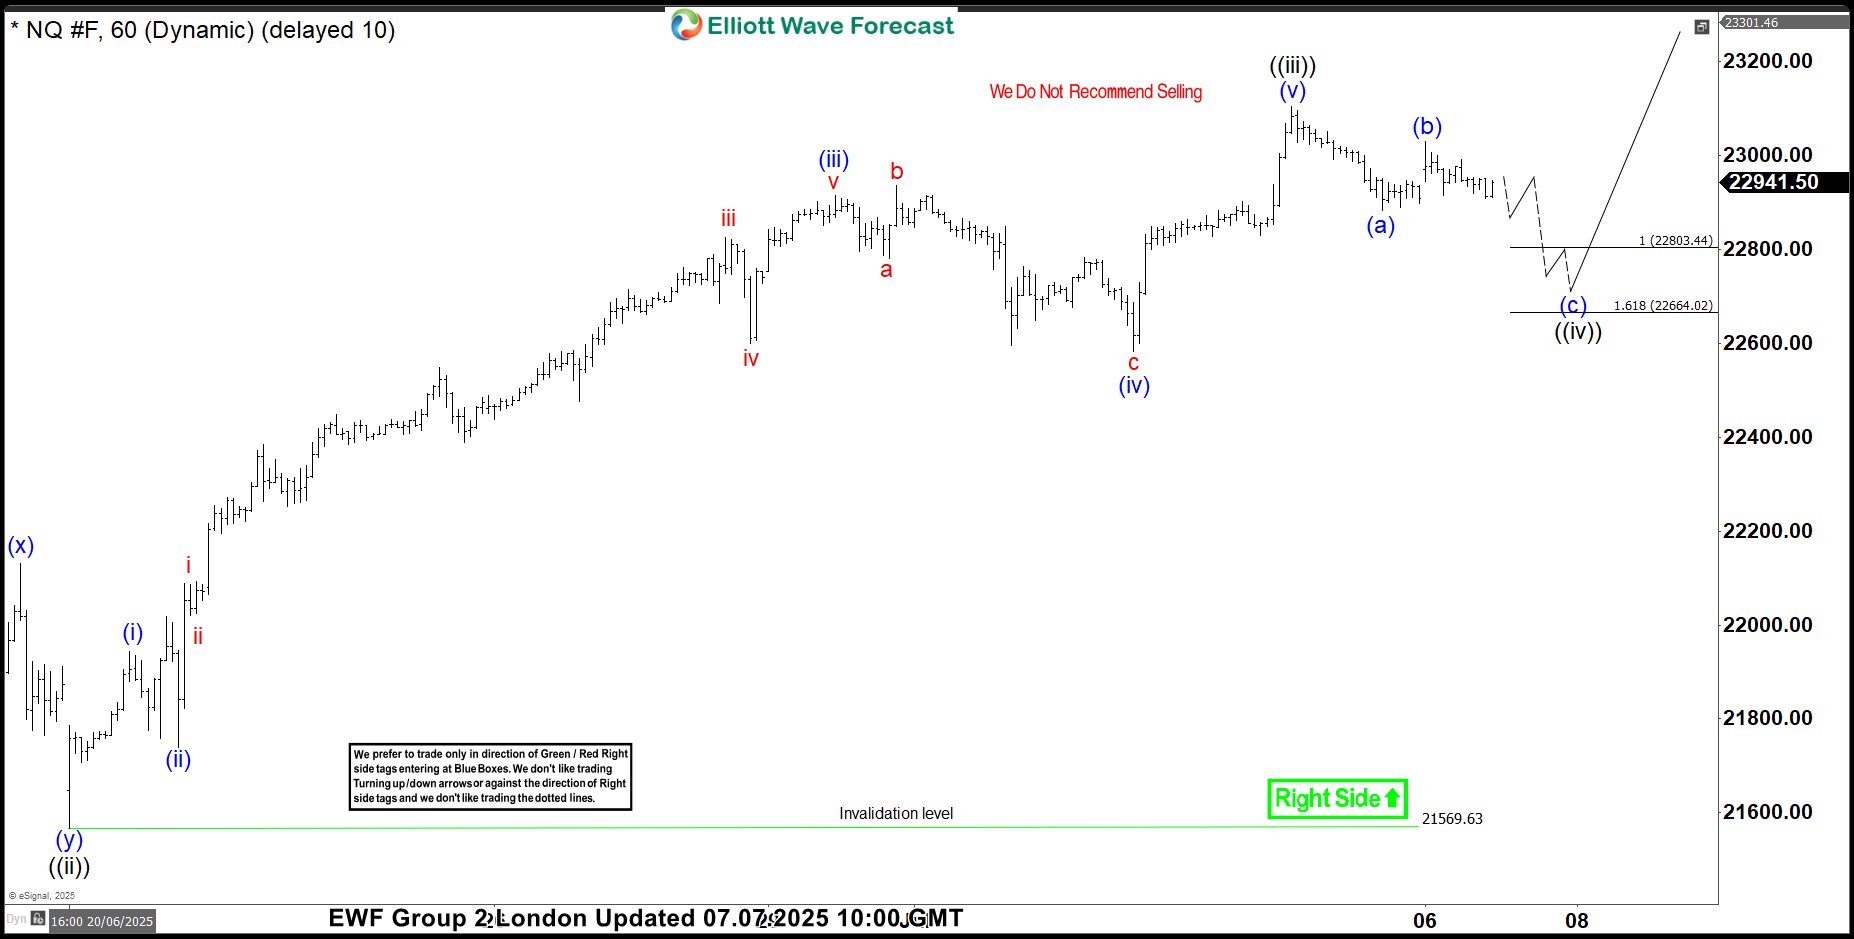
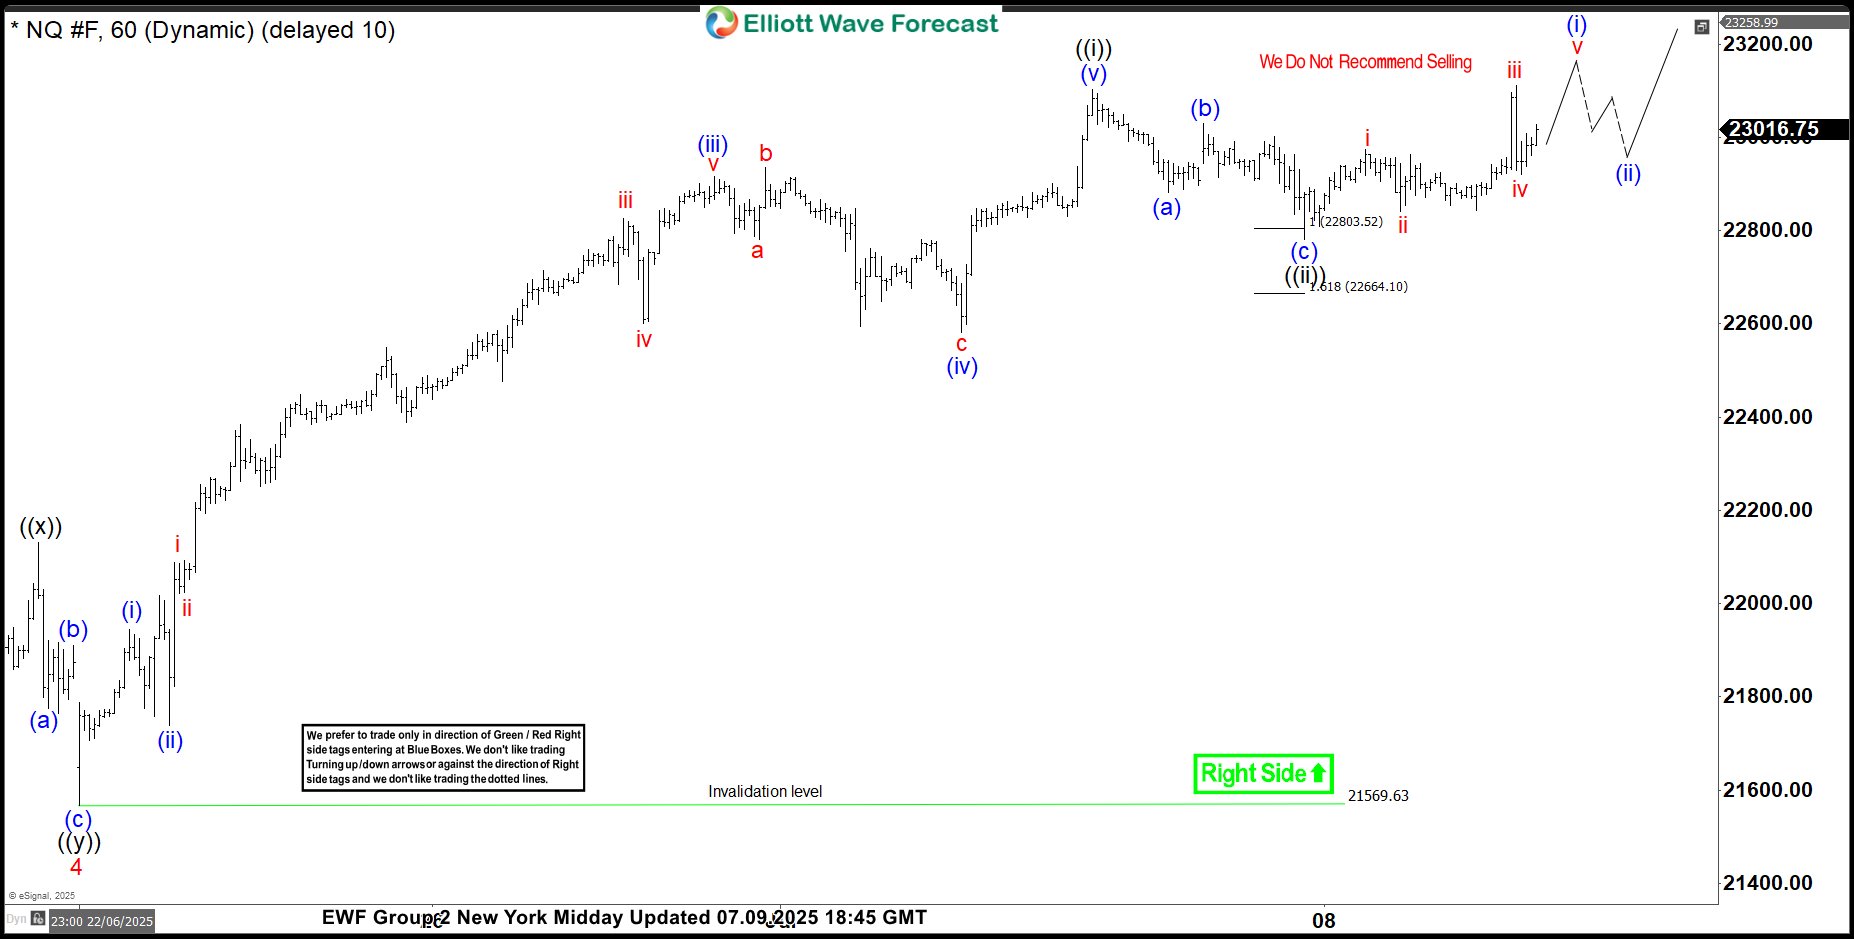
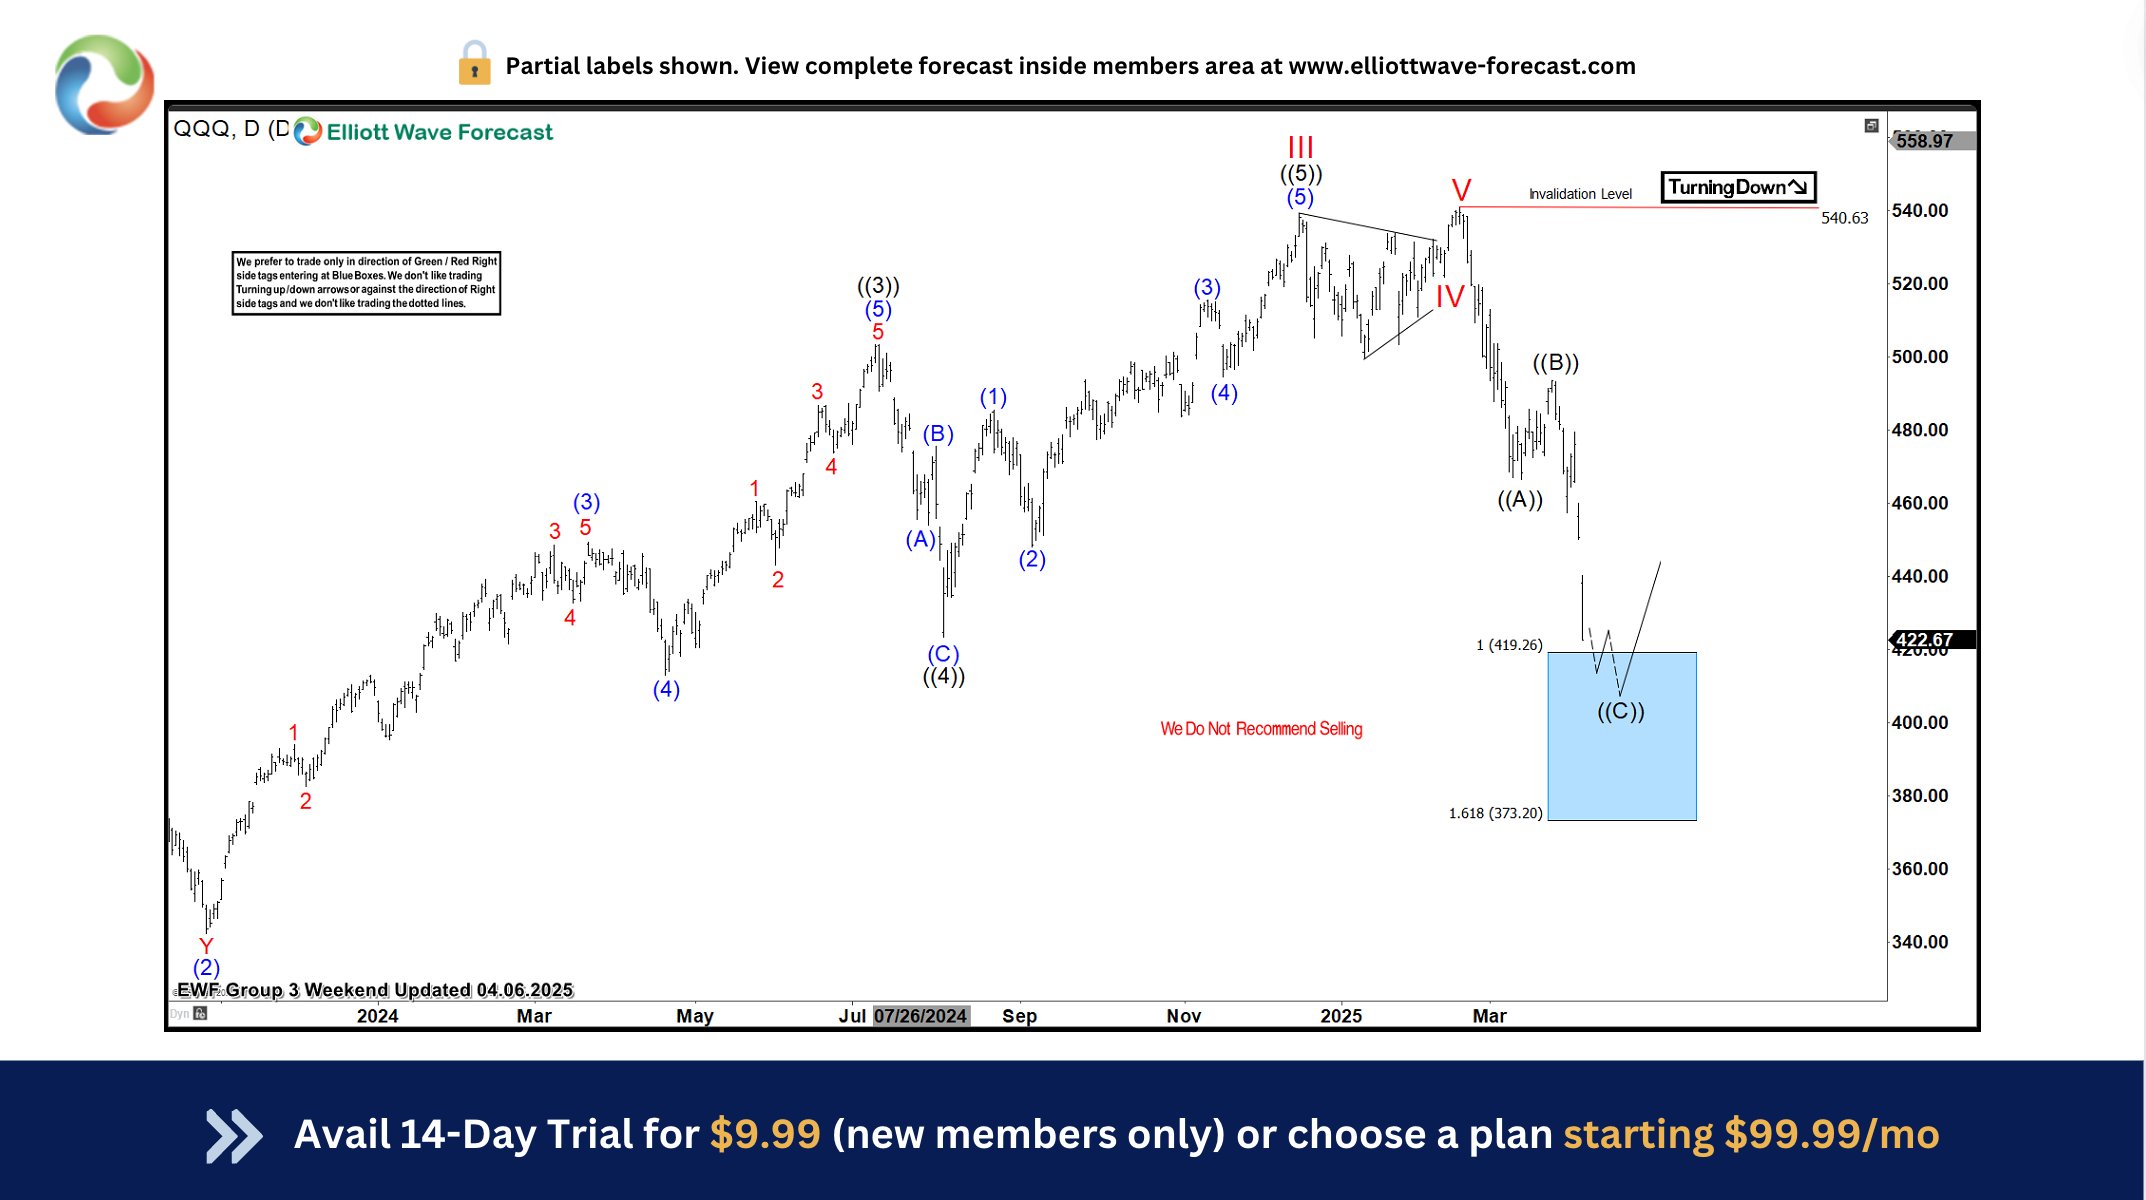
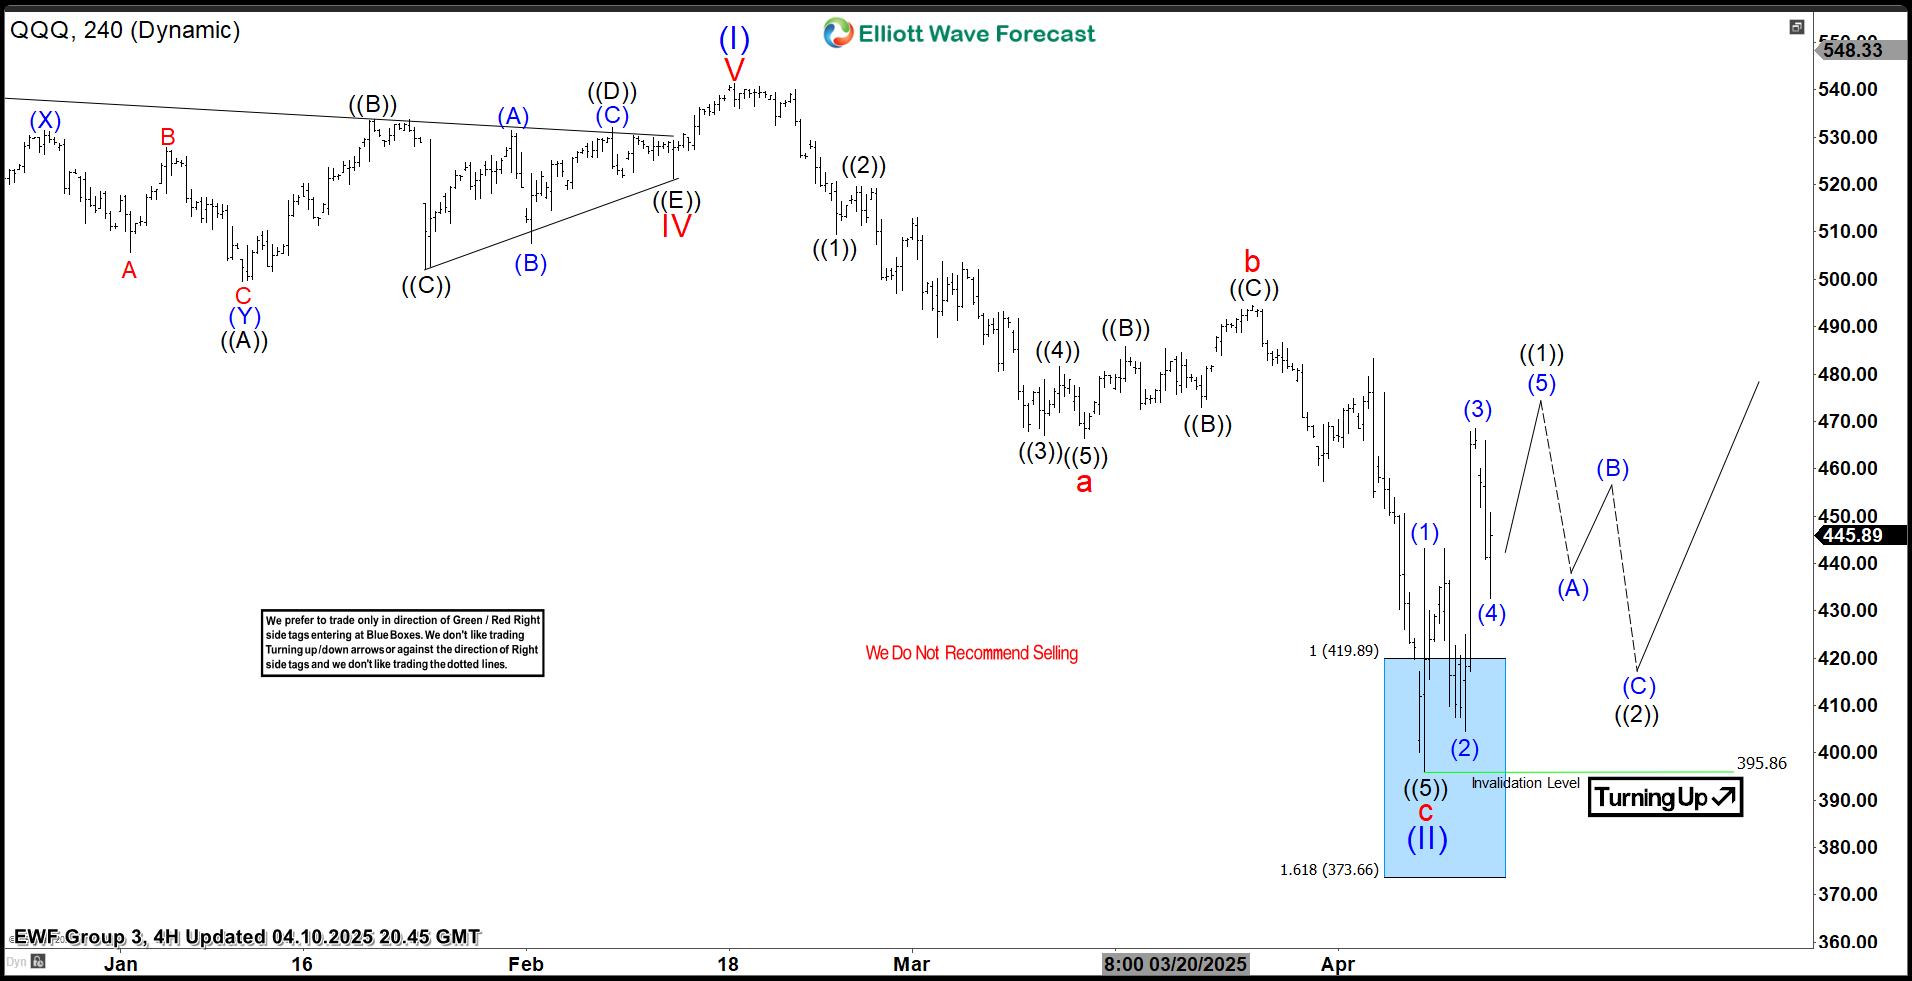
Hello traders. As our members know we have had many profitable trading setups recently. In this technical article, we are going to talk about another Elliott Wave trading setup we got in E-mini Nasdaq-100 Futures. Recently NQ_F made a clear three-wave correction. The pull back completed as Elliott Wave Double Three pattern and made a decent rally. In this discussion, we’ll break down the Elliott Wave pattern and present targets. Let’s start by explaining the pattern.
NQ_F Elliott Wave 4 Hour Chart 11.18.2025
The Futures is forming a 3-wave pullback in wave (4) blue. At the moment, we can see incomplete sequences from the main peak, labeled as wave (3) blue. Our members know that we constantly emphasize the importance of incomplete sequences, as these determine the market’s path.
The structure suggests more weakness toward the Equal Legs area at 24145–23097, where we are looking to re-enter as buyers. We expect at least a three-wave bounce from the Blue Box area.
Did you know ? 90% of traders fail because they don’t understand market patterns. Are you in the top 10%? Test yourself with this advanced Elliott Wave Test
Official trading strategy on How to trade 3, 7, or 11 swing and equal leg is explained in details in Educational Video, available for members viewing inside the membership area.
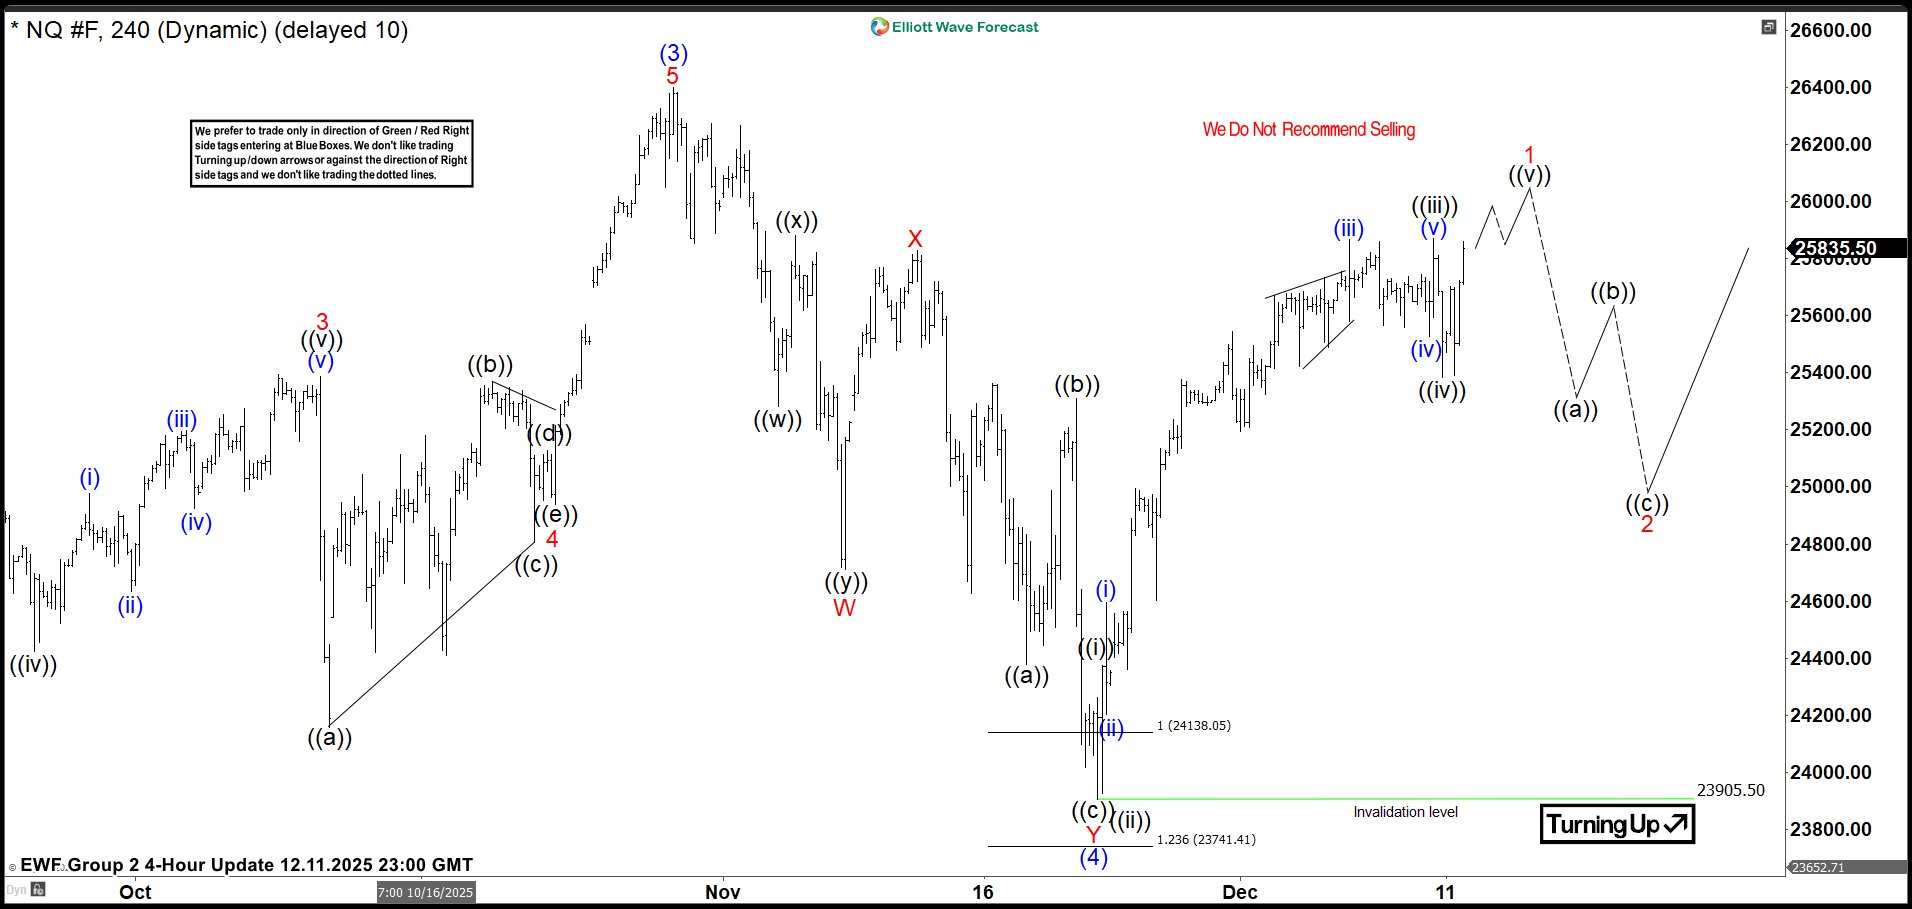
NQ_F Elliott Wave 4 Hour Chart 12.11.2025
E-mini Nasdaq-100 Futures found buyers as expected at the Blue Box area, making decent bounce. While above the last low 23905 low we count (4) blue correction completed. Wave (5 ) can be in progress toward new highs, targeting 26989 area.
Reminder for members: Our chat rooms in the membership area are available 24 hours a day, providing expert insights on market trends and Elliott Wave analysis. Don’t hesitate to reach out with any questions about the market, Elliott Wave patterns, or technical analysis. We’re here to help.
Elliott Wave Forecast
At Elliott Wave Forecast, we track and analyze 78 instruments daily — but remember, not every chart is a direct trading signal.
For real-time, actionable trades, join our Live Trading Room, where we guide you through clear, professional setups every day.
🚀 Not a member yet? Now’s the perfect time, we have limited time Promo Offer :
Unlock full access with our 14-day Trial for just $0.99!
Here’s what you’ll get:
✅ Official Trading Signals — with clearly defined Entry, Stop Loss, and Take Profit levels based on our proven strategy.
✅ Live 24 Hour Chat Room Access — ask unlimited questions and get expert support during trading hours (Monday–Friday).
✅ Expert Analysis — real-time updates across Forex, Stocks, Indices, Commodities, Cryptos, and ETFs.
✅ Hands-on Learning — sharpen your trading skills with direct mentorship from seasoned market analysts.
Offer Expires Soon!
Get full access to real-time Signals, Live Sessions, 24 Hour Chat Room Support and Expert Analysis — all for only $0.99 during your 14-day trial.
⏳ This limited-time price will expire soon — don’t miss out!


