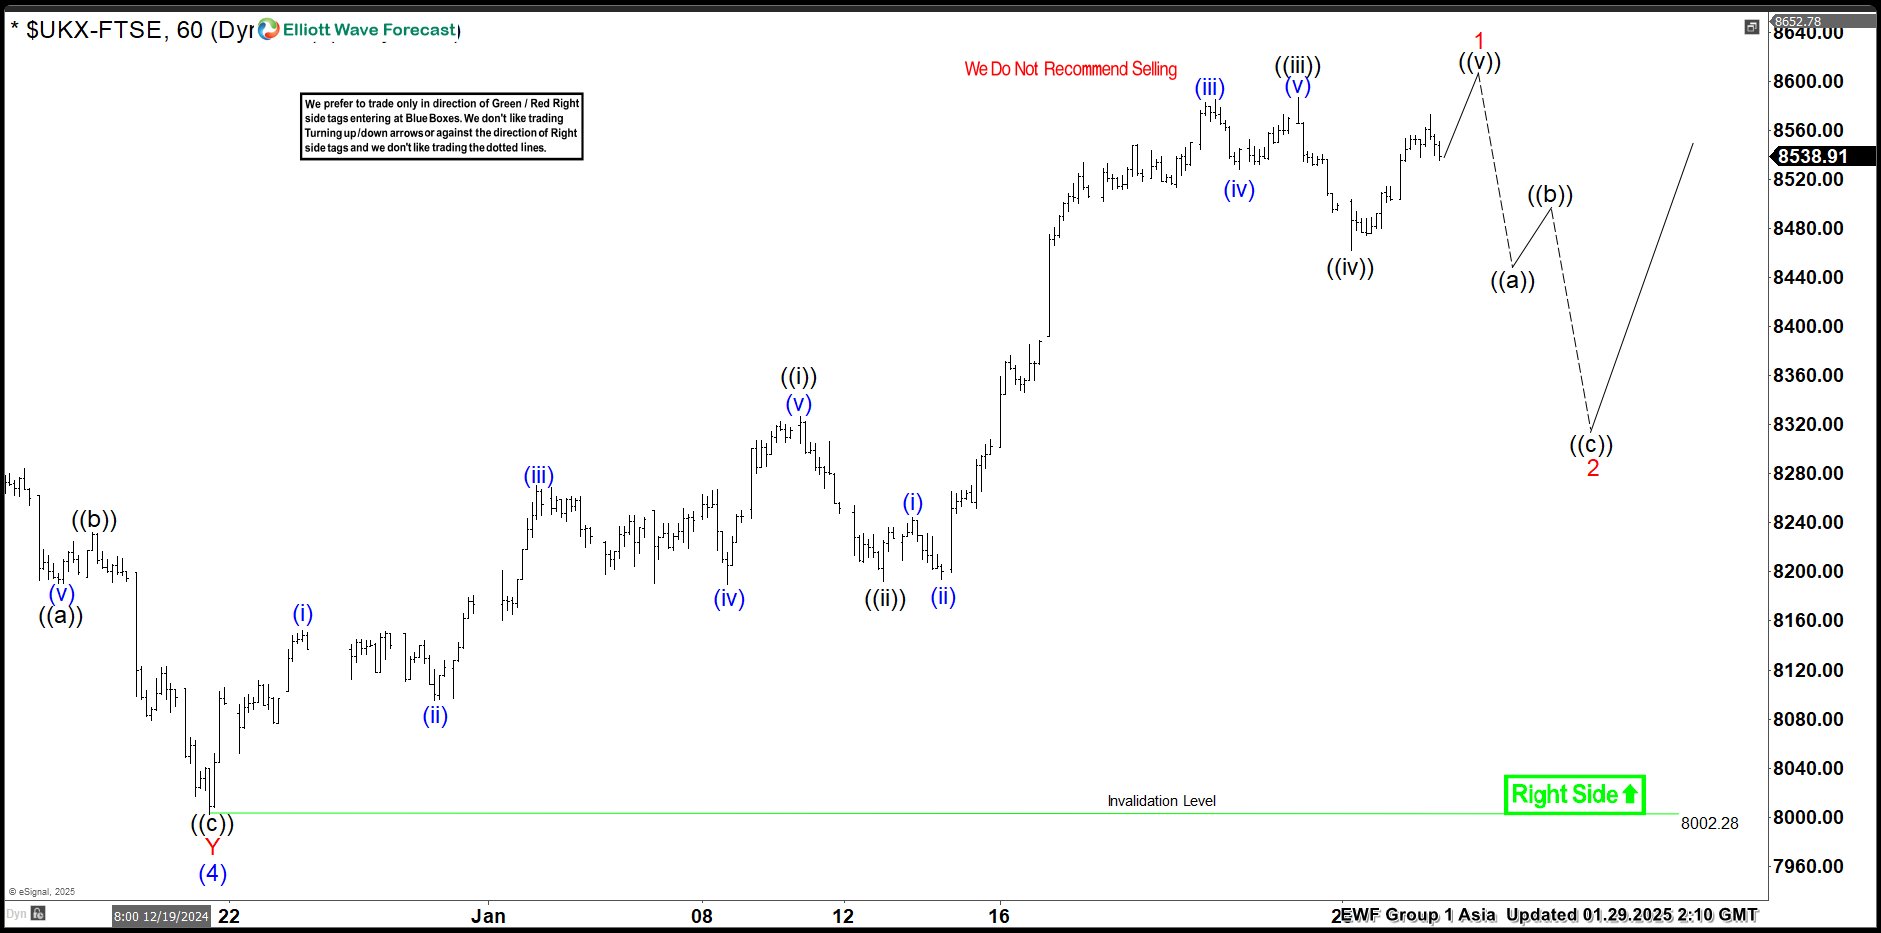
Short Term Elliott Wave View in FTSE index shows that the Index breaks to new all-time highs confirming the right side of the market remains bullish. The rally from 12.20.2024 low looks to be extending higher in an impulsive structure within wave 1. While pullback to 8002.28 low ended wave (4) as a triangle consolidation & made new highs supports more strength to continue. Up from wave (4), wave (i) ended at 8152.01 high and wave (ii) pullback ended at 8094.88 low.
The Index resumed higher in wave (iii) which ended at 8270.60 high. Pullback in wave (iv) ended at 8189.50 low. The final leg wave (v) ended at 8326.32 low which also completed wave ((i)) in higher degree. Index then pullback in wave ((ii)) which ended at 8192.31 low. Index has resumed higher again in wave ((iii)). Up from wave ((ii)) low, lesser degree wave (i) ended at 8244.31 high. Pullback in wave (ii) ended at 8193.54 low. Wave (iii) higher ended at 8584.73 high and pullback in wave (iv) ended at 8527.92 low. Then final push higher towards 8586.68 high ended wave (v) thus completed wave ((iii)). Down from there, wave ((iv)) pullback ended at 8462.18 low. Near-term, as far as dips remain above 8462.18 low the index is in process of 3 waves advance with 1 more push higher. Minimum towards 8616.11- 8663.95 area higher to end wave ((v)) of 1. Afterwards, a pullback in wave 2 is expected to take place in 3, 7 or 11 swings before more upside resumes.
FTSE 1-Hour Elliott Wave Chart From 1.29.2025
FTSE Elliott Wave Video
