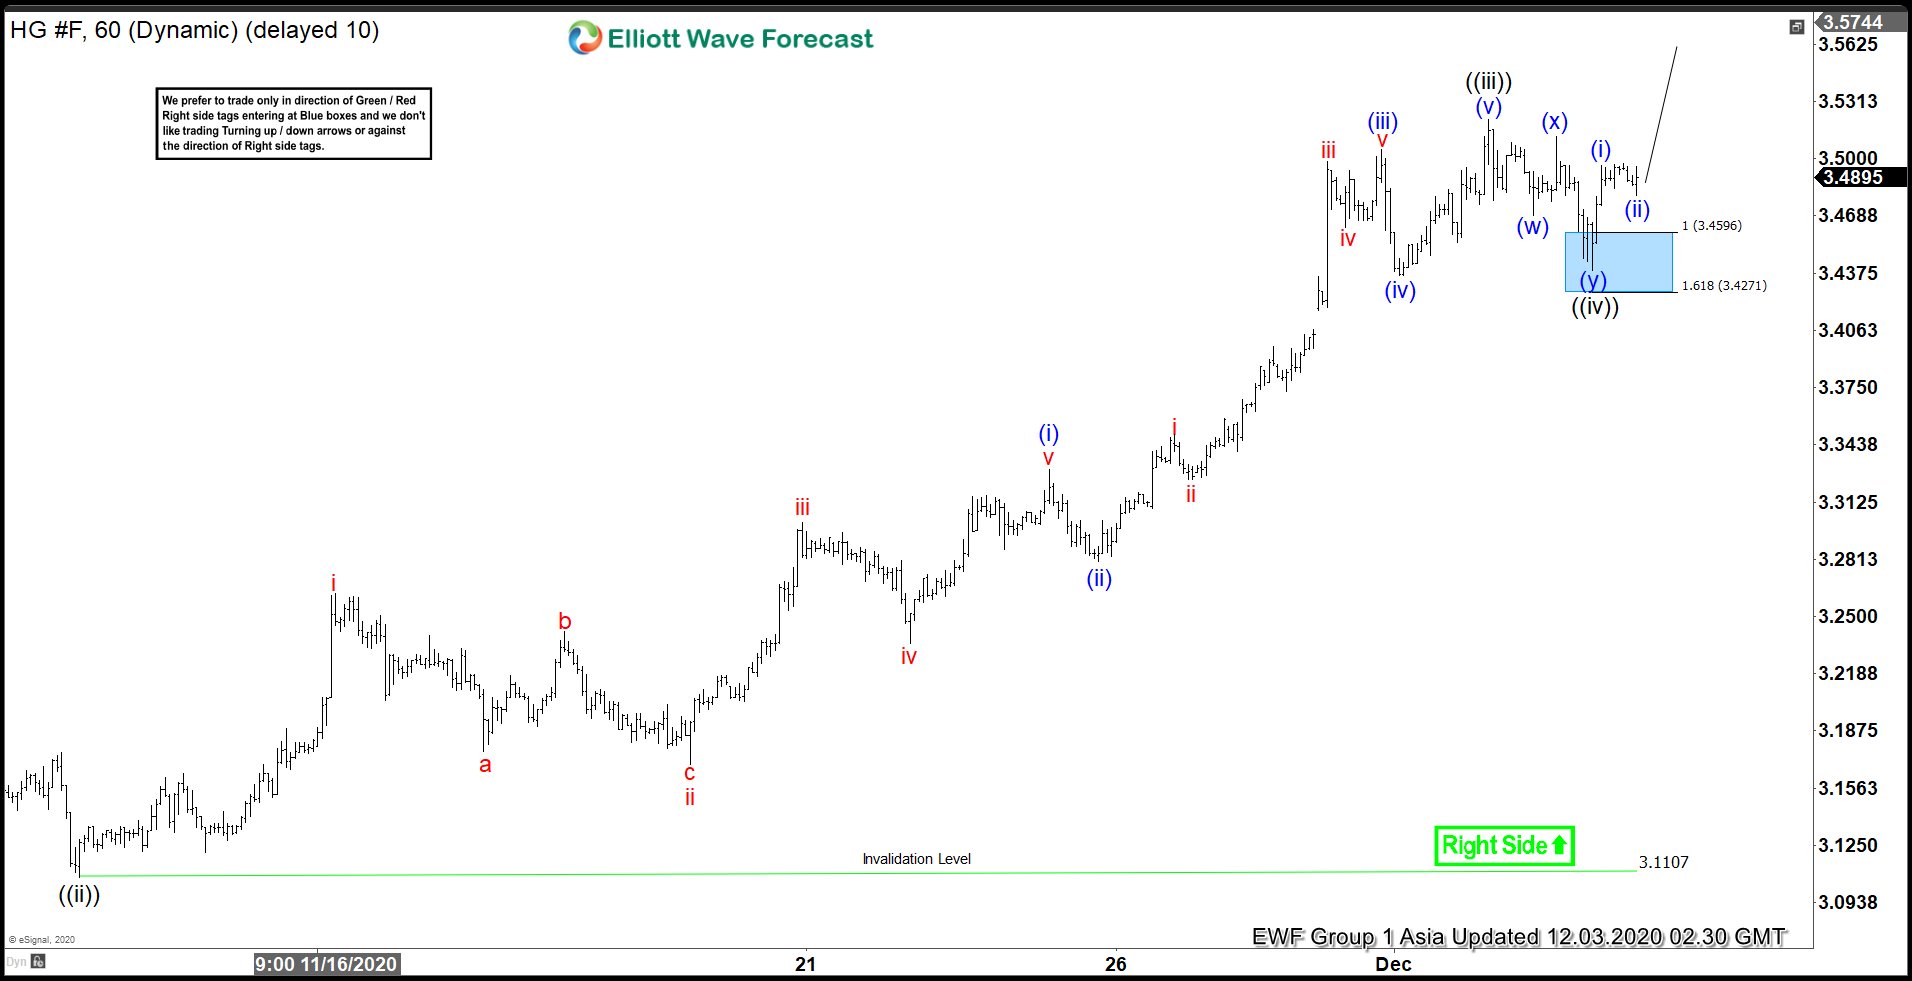
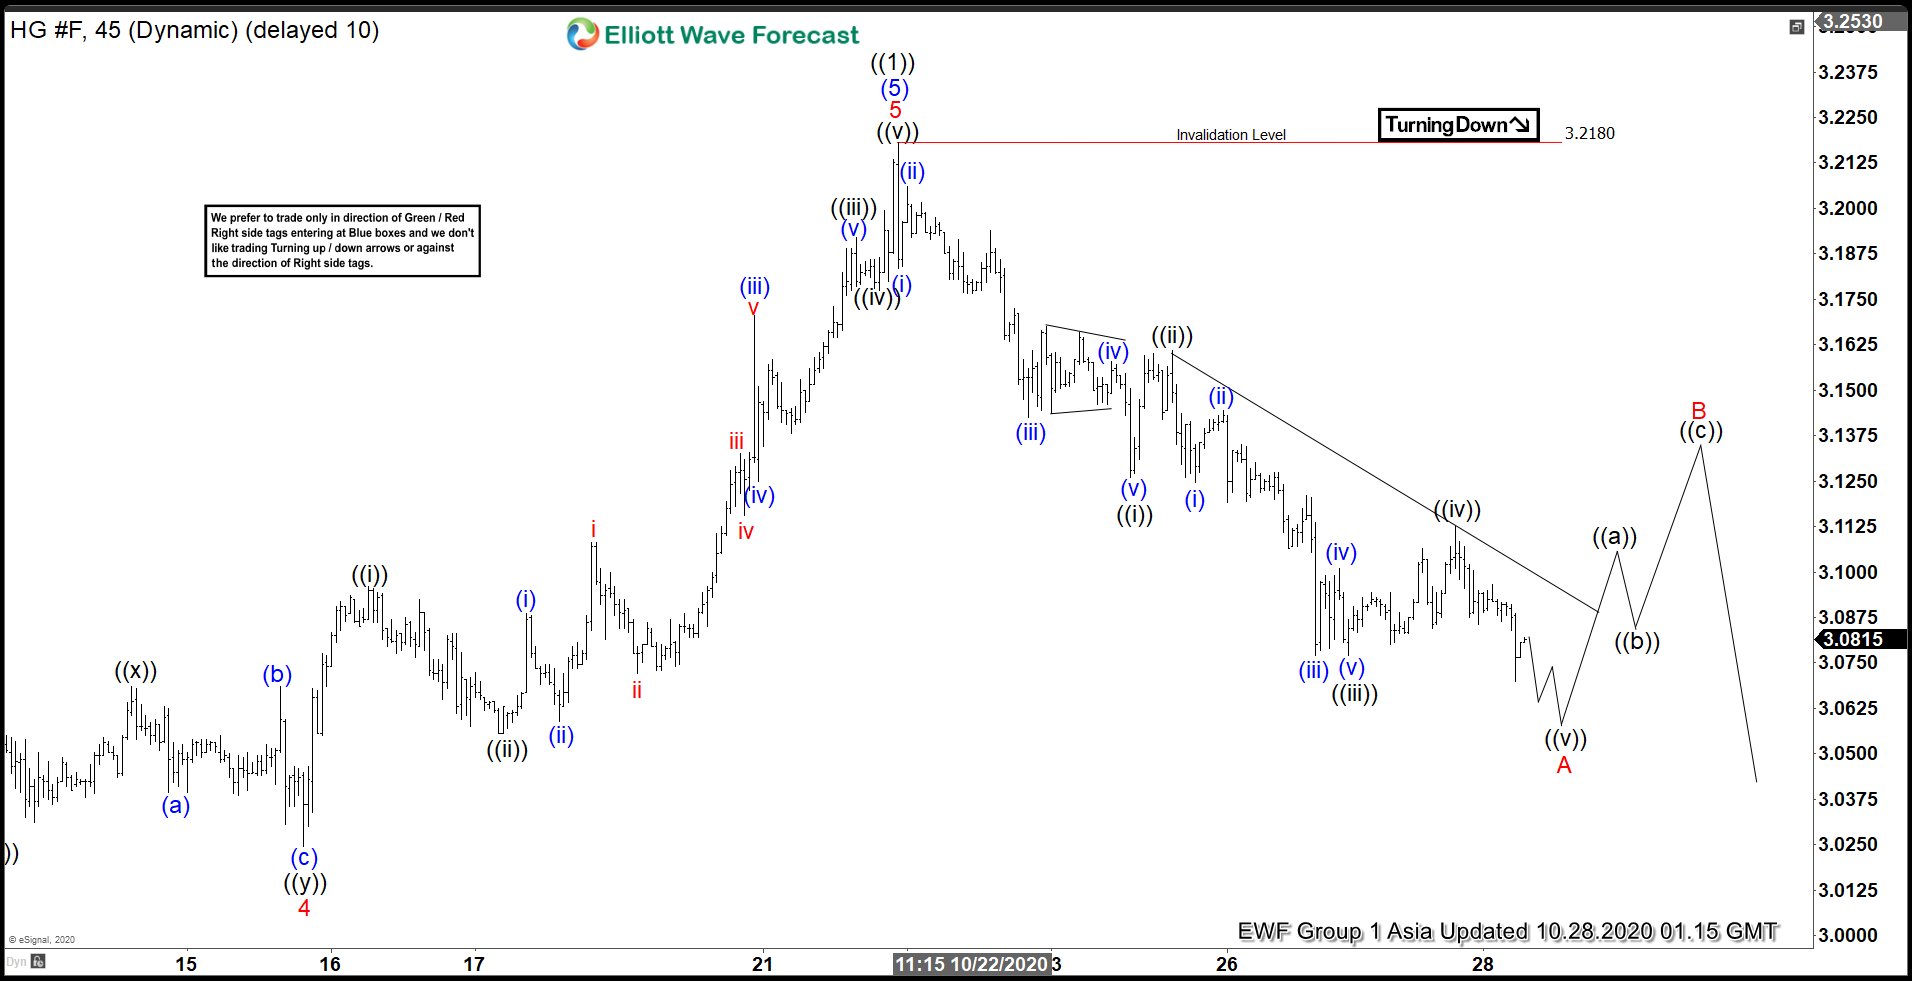
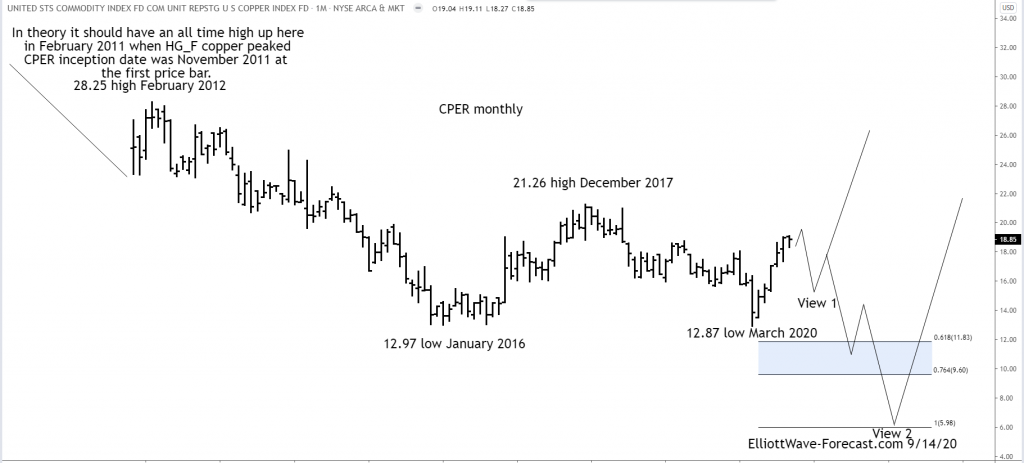
Hello fellow traders. Copper Futures ( $HG_F ) is another instrument that has given us nice trading opportunity lately . As our members know the commodity is showing impulsive bullish sequence in the cycle from the March 2020 low. We recommended members to avoid selling the commodity and keep on buying the dips in 3,7,11 sequences when get chance. In this technical blog we’re going to take a quick look at the charts of Copper published in members area of the website and explain the Elliott Wave structure and trading strategy.
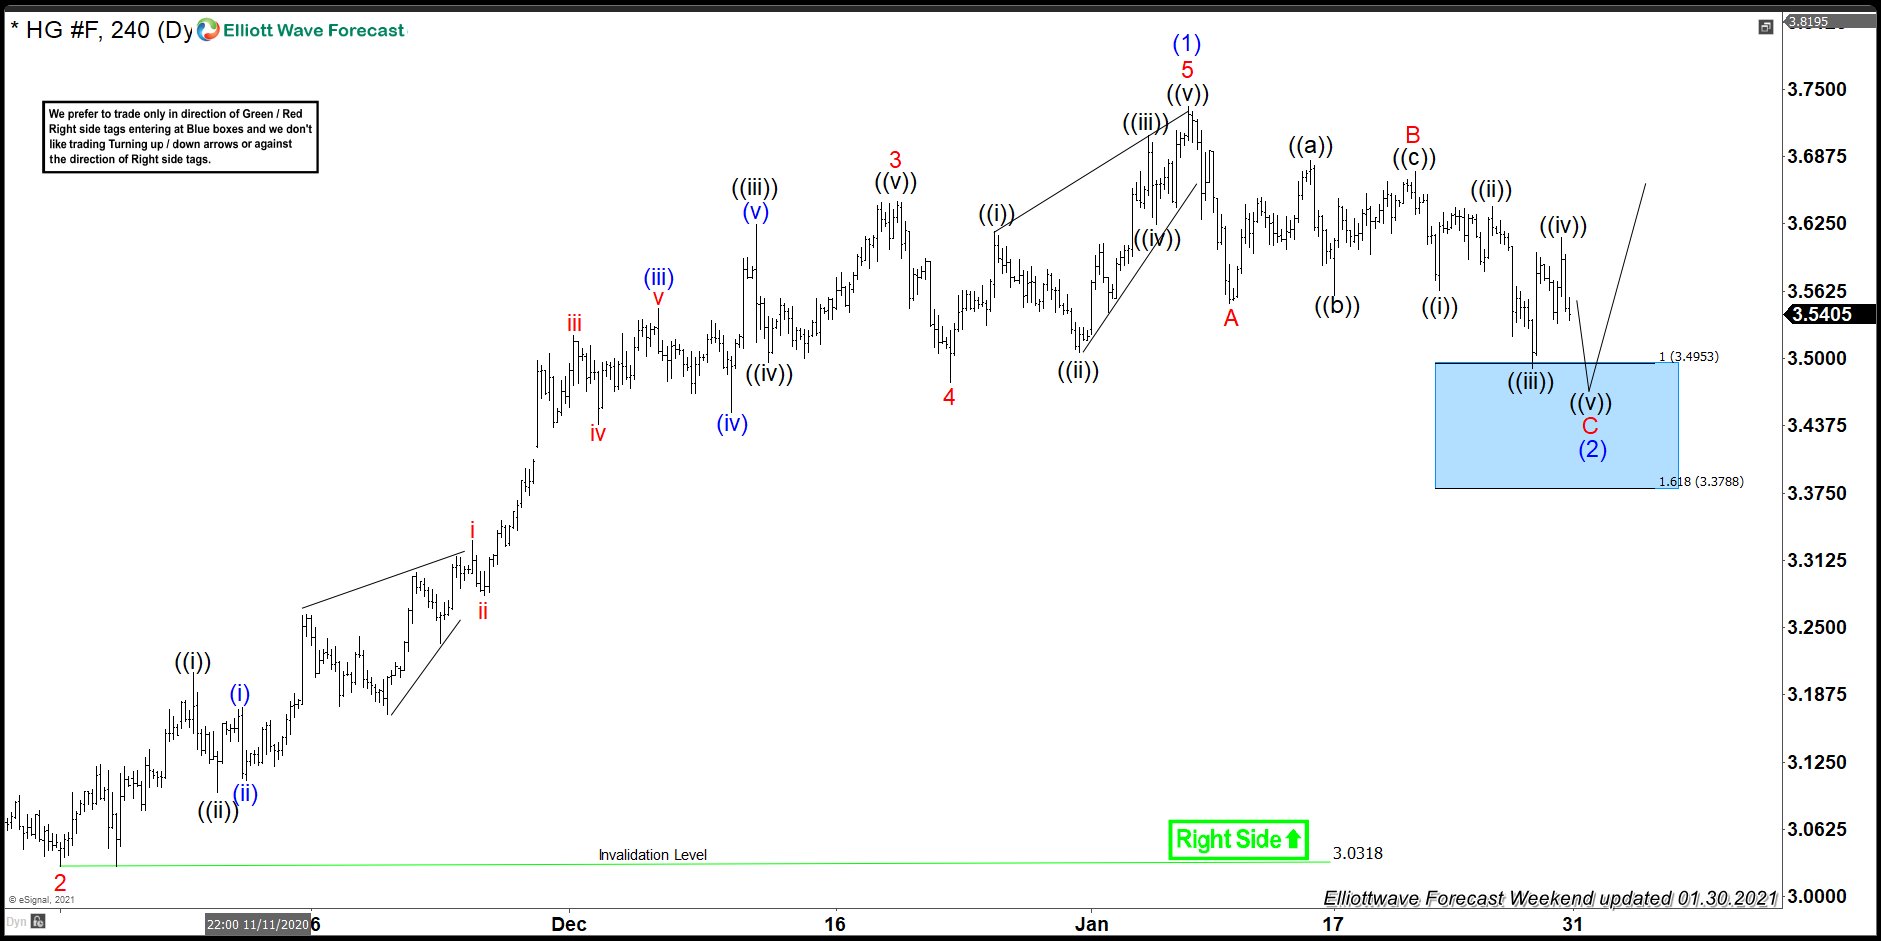
Copper Elliott Wave 4 Hour Chart 1.30.2021
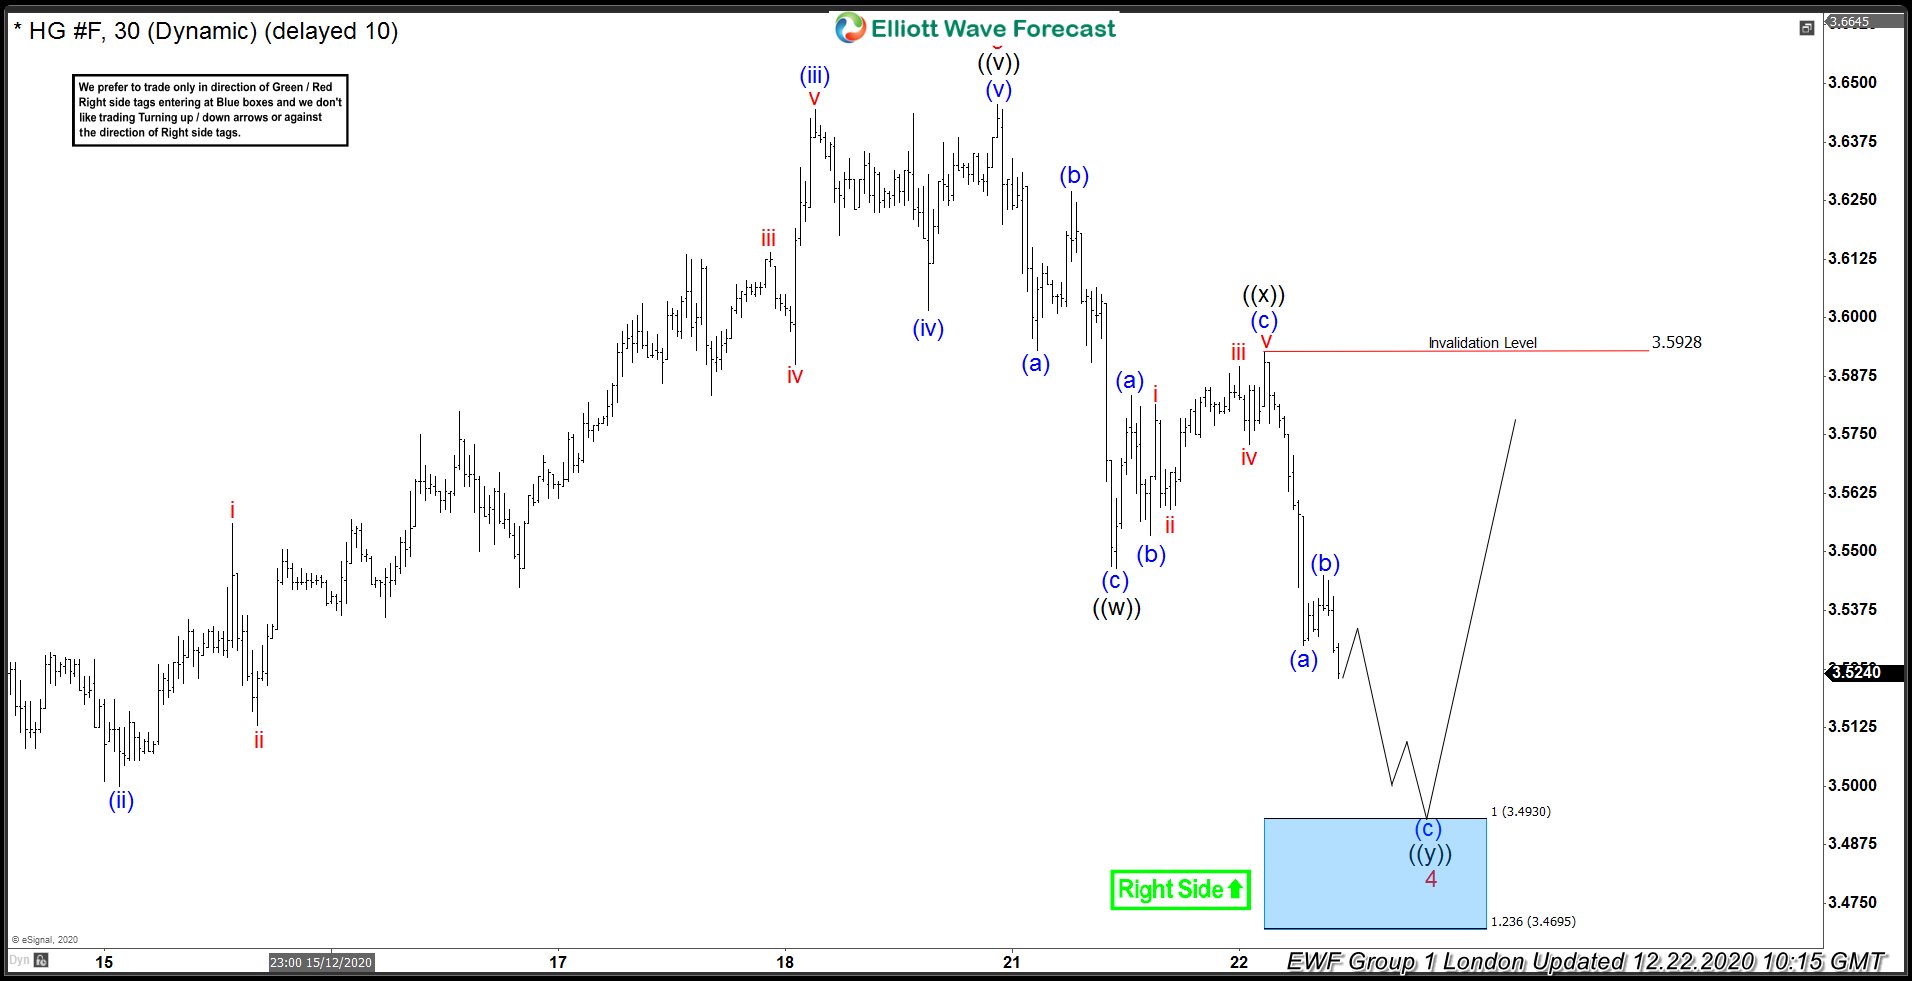
Copper remains bullish against the 3.0318 low . Pull back has reached its equal legs at 3.4953-3.3788 ( buyers area). We see possibility that Copper can make another leg down toward blue box. However, we should keep in mind that minimum number of swings is already in place and turn could happen any moment. Anyway , equal legs is reached and long positions are already open. The main trend is bullish we expect to see at least 3 waves bounce from the marked zone. As our members know Blue Boxes are no enemy areas , giving us 85% chance to get a reaction.
You can learn more about Elliott Wave Patterns at our Free Elliott Wave Educational Web Page.
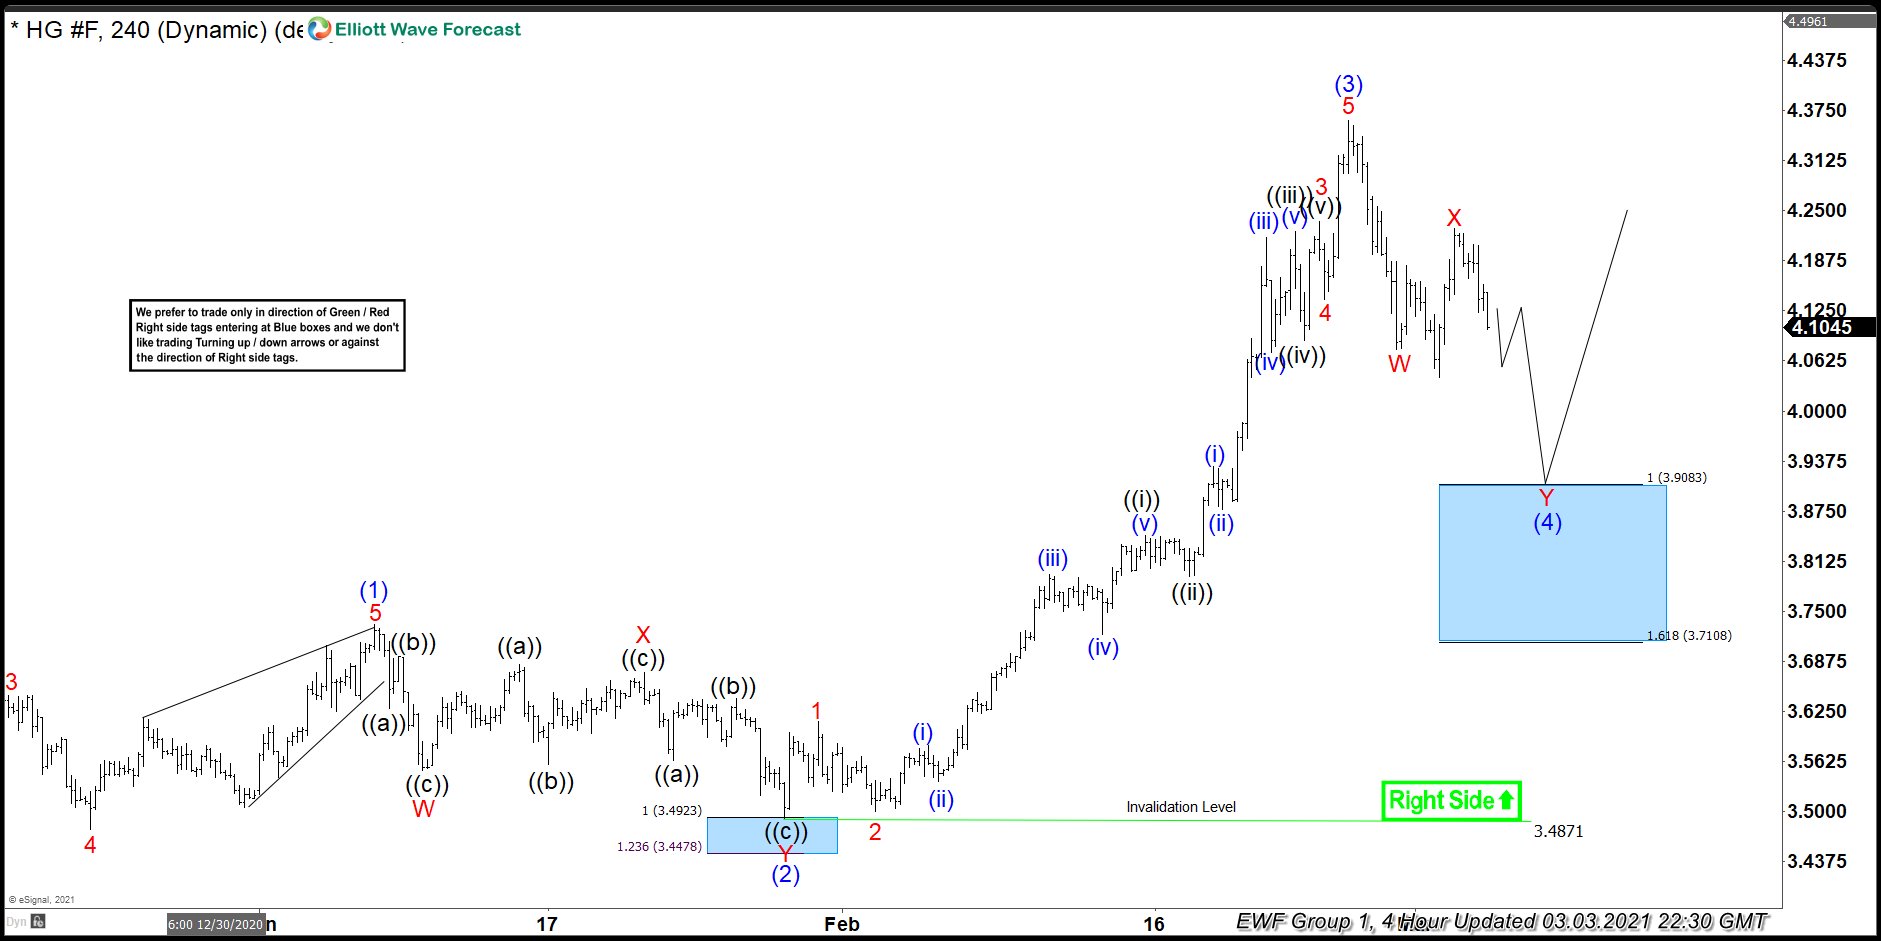
Copper Elliott Wave 4 Hour Chart 3.3.2021
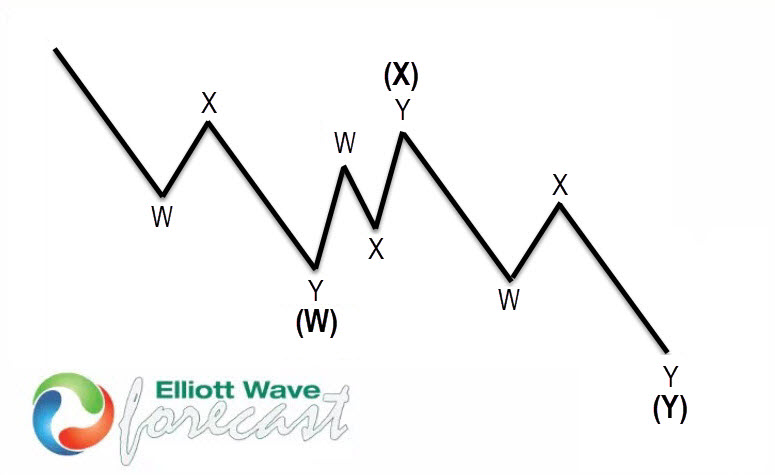
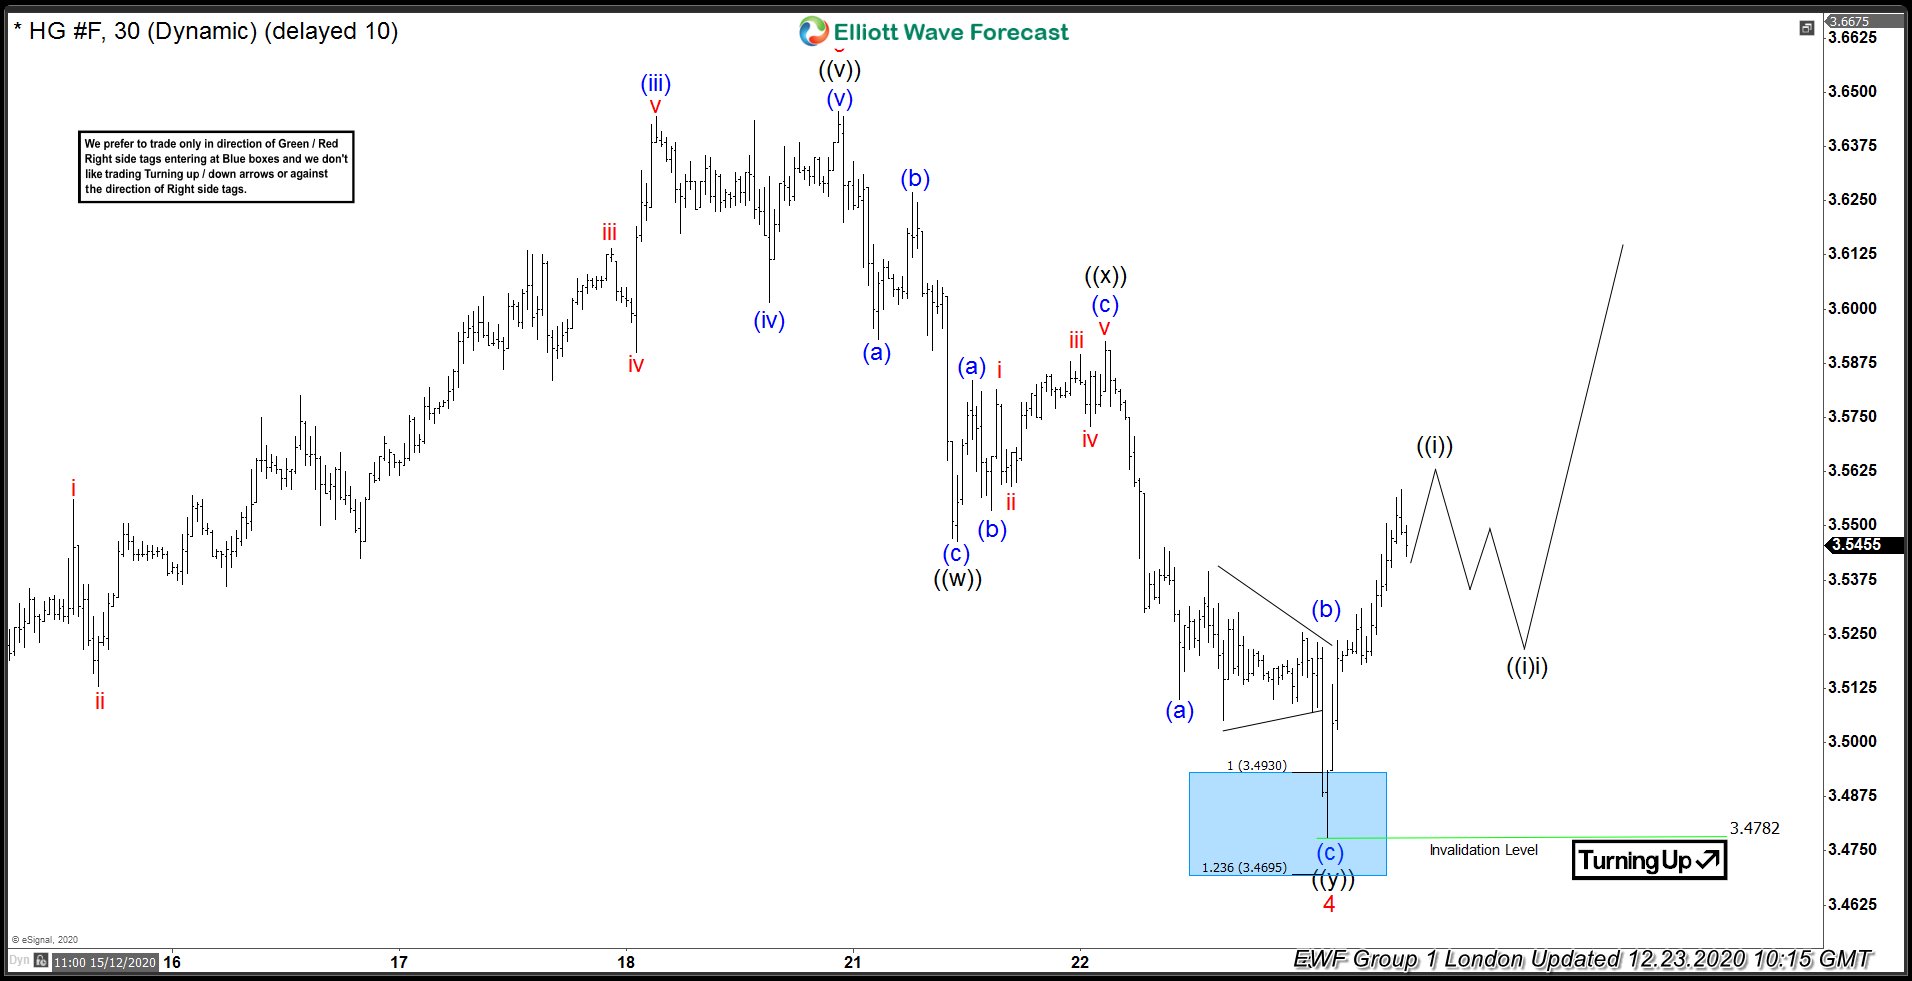
The commodity found buyers as we expected. Copper has given us very good rally from the buying zone 3.4953-3.3788 . Pull back (2) ended at 3.4781 low. Currently Copper is giving us (4) pull back that is correcting cycle from the 3.4781 low. Pull back looks to be unfolding as Elliott Wave Double Three Pattern that has scope to reach 3.908-3.7108 area. At that zone we would like to be buyers again.
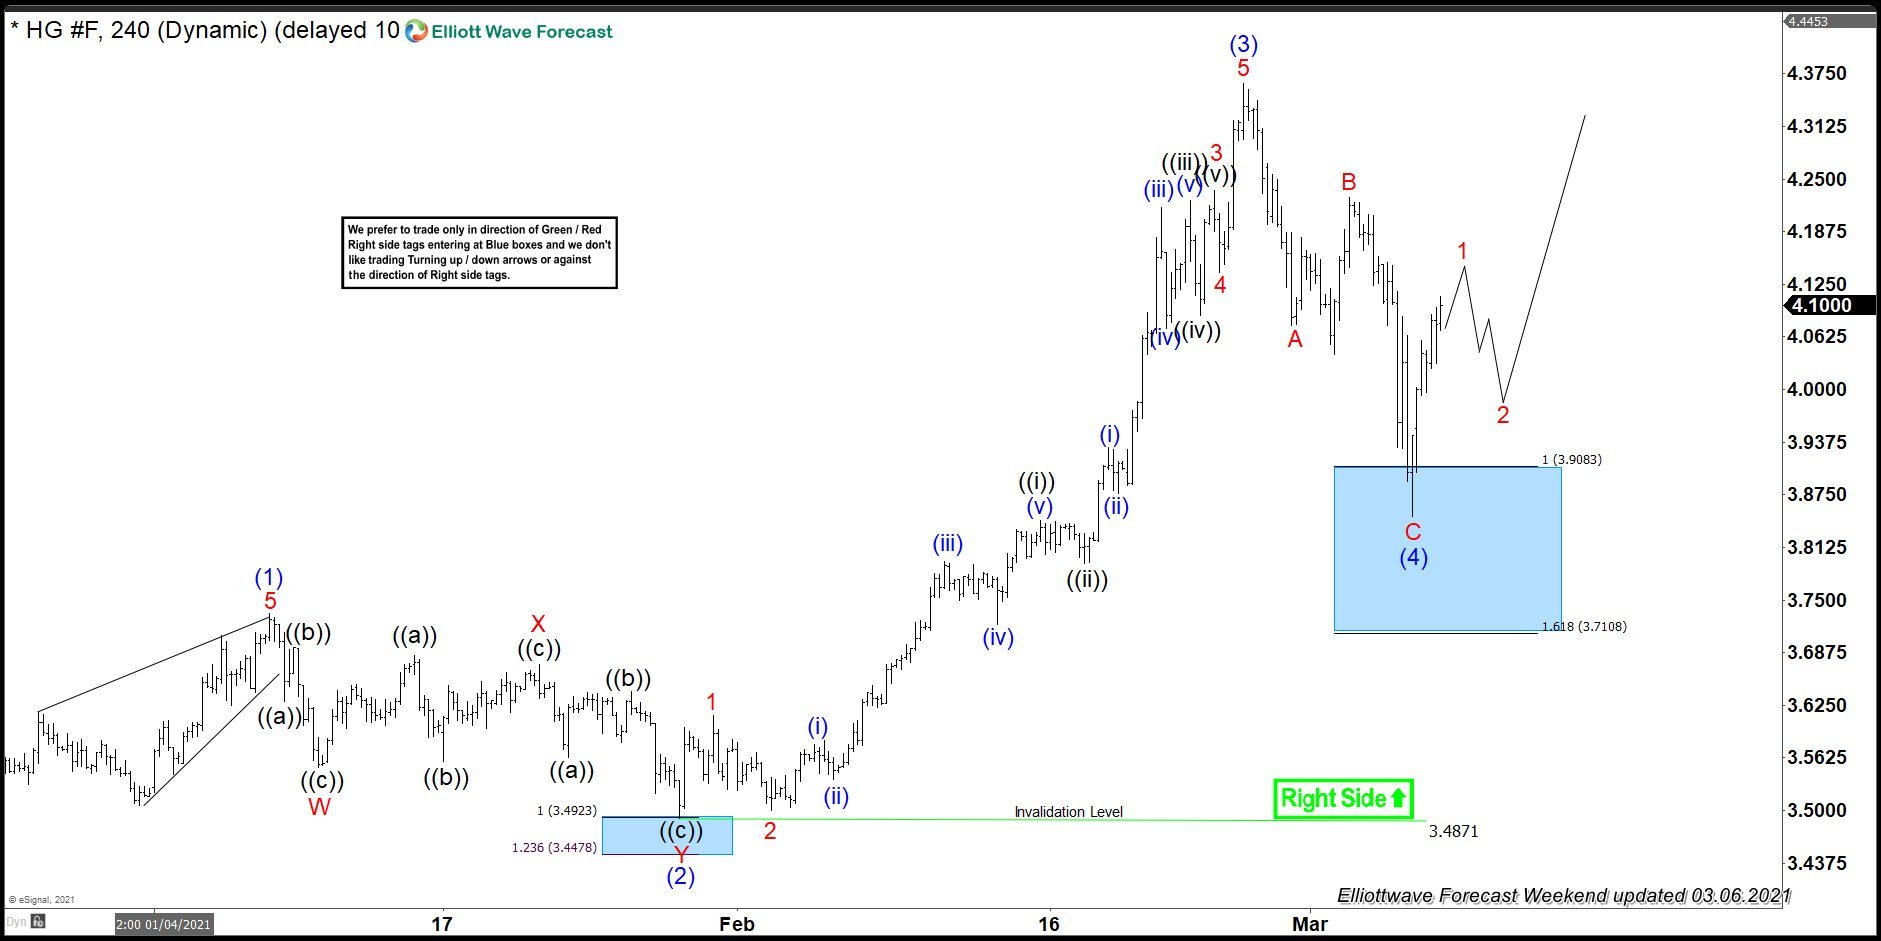
Copper Elliott Wave 4 Hour Chart 3.3.2021
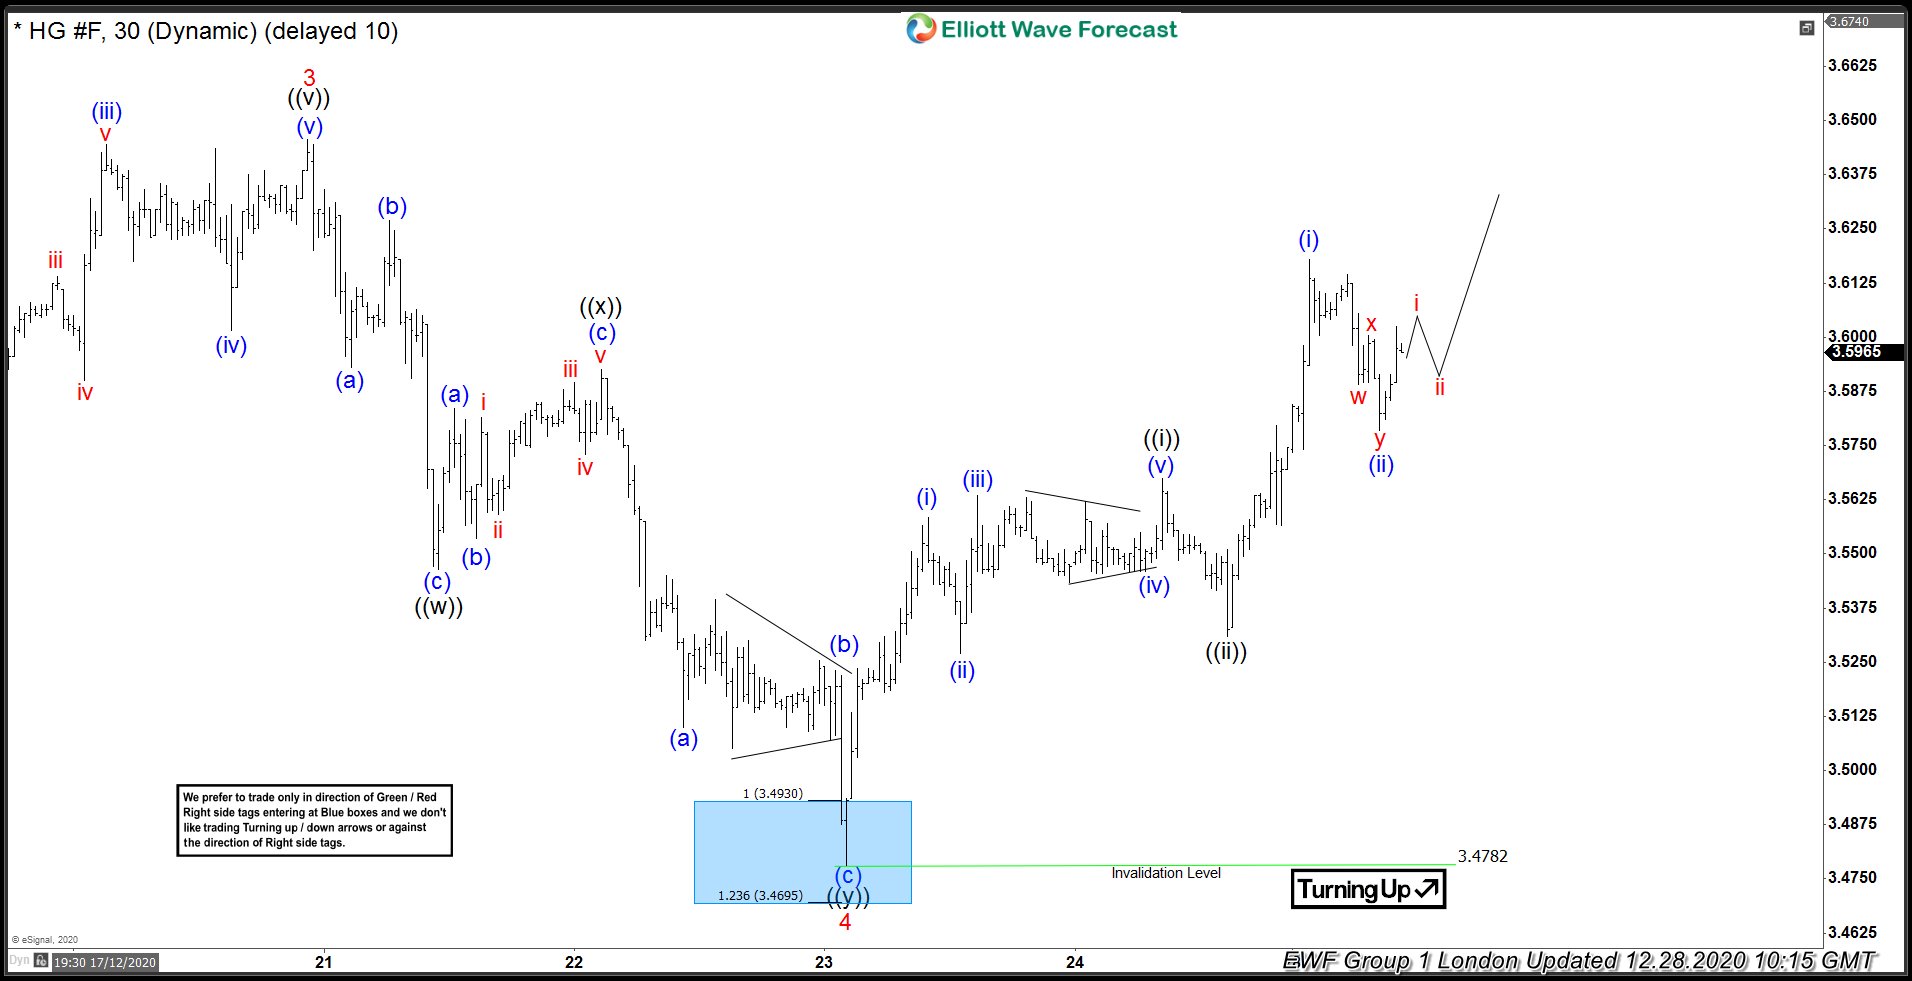
Copper pair found buyers at 3.4953-3.3788 the Blue Box area. We got nice reaction from there so far. We call wave (4) blue pull back completed at 3.8503 low. Bounce from the buying zone has already reached 50fibs against the B red high, so long positions are risk free. We would like to see further extension higher and break above (3) blue peak (02/25) to confirm next leg up is in progress.
Elliott Wave Forecast
We cover 78 instruments in total, but not every chart is trading recommendation. We present Official Trading Recommendations in Live Trading Room. If not a member yet, Sign Up for Free 14 days Trial now and get access to new trading opportunities. Through time we have developed a very respectable trading strategy which defines Entry, Stop Loss and Take Profit levels with high accuracy.
Welcome to Elliott Wave Forecast !
