What Is Day Trading?
Day trading is the act of buying and selling stocks within a very short window of time. Day Trading aims to make a bunch of small profits which add up to big gains over time. Traders who practice Day trading usually buy a stock for a few hours or even minutes and with a slight change in price might sell instantly. Day traders are short-term investors.
Day traders will buy and sell stocks based on current events and any company news published. For example, quarterly profit statements, product launches, or major announcements. Day traders focus on the current ongoings of the company and the market. Some traders might even use sophisticated algorithms or analyze charts to try to figure out when might be the best time to buy or sell.
A day trader makes money in one of two ways:
- If the stock is moving higher or he/she thinks that it might go higher that day, they’ll buy the stock and then sell it once its value goes up. But if the stock’s value drops, then they’ll lose money when they sell it. Pretty straightforward!
- If a day trader foresees a huge price drop that day, he/she might try to “short sell” it. When someone short sells a stock, they profit when the price of a stock goes down.
Day traders try to make the best out of market volatility by buying and selling during volatile hours also.
Why Day Trading is Risky?
- It is almost impossible to predict which direction these stocks will move during the day. One wrong prediction could make investors lose huge amounts of money. Hence, several risks are involved. Day Trading is more like a gamble.
- Day Trading is expensive. It comes with costly commissions and transaction fees that can erode away profits you are earning along the way. Therefore, in order to avoid that your profits need to be high in order to cover those costs. In addition to it, earnings from day trading will also be subject to short-term capital gains taxes, which is the same rate as your income tax rate.
- Day Trading is stressful. Day trading is like a roller coaster ride with multiple ups and down all during the same day. And all this takes an emotional and psychological toll on the trader.
- Requires dedication and expertise. Day trading requires a sophisticated level of monitoring market trends and events from multiple reliable sources. Hence, dedicating a considerable amount of time is necessary. It is not suitable for individuals with full-time jobs.
Read:
- Forex vs stocks
- Top infrastructure stocks
- Best 3D printing stocks
- Buzzing stocks
- Top trending stocks
- Best AI backed stocks
Why Day Trading can be Beneficial?
- Possibility for Profitability -A key advantage of day trading is that it maximizes inefficiencies and volatility in the financial markets. Individuals who buy and sell a particular asset within a specific trading day can earn considerable gains from the minute price movements. In addition to it, limiting trading within a specific day also removes the risks that come from holding an asset overnight. A shorter duration and more frequent buy-and-sell allow returns on investment to compound more quickly.
- Availability of Different Strategies – There are different strategies available to day traders that help them maximize short-term price movements. For example, a news-based strategy involves actively looking for market information or other events from various sources that are likely to affect price movements.
- Ease of access to trading platforms – The availability of different platforms has made investing and trading more accessible and convenient. These online-enabled platforms have made day trading more advantageous because of the availability of a huge selection of instruments and assets such as stocks, currencies and cryptocurrencies, futures and contracts, and commodities, among others.
What Strategies to Adopt?
In order to make the best out of Day trading, traders have to move and invest strategically in the stock market. Therefore, here are a few strategies that they make use of to invest better and smart:
- Scalping – It focuses on making numerous small profits on ephemeral price changes that occur throughout the day.
- Range trading – This strategy allows traders to use pre-determined support and resistance levels in prices to determine the trader’s buy and sell decisions.
- News-based trading – By adopting this strategy, traders can seize trading opportunities from the heightened volatility that occurs around news events.
- High-frequency trading (HTF): These strategies use sophisticated algorithms to exploit small or short-term market inefficiencies.
Checkout:
- Accurate and Reliable Gold Forecast
- Reliable and Trusted Commodity Signals
- Reliable forex signals
Best Day Trading Stocks
Here is a list of Best Day Trading Stock to invest in now:
| Sr. | Company Name | Symbol | Market Cap | Price | Average Traded Volume ( 10 Day) |
| 1 | Tesla Inc. | TSLA | $ 612.25 billion | $ 193.17 | 126.01 million |
| 2 | Carvana | CVNA | $ 2.085 billion | $ 11.74 | 14.94 million |
| 3 | Meta Platforms | META | $ 671.54 billion | $ 262.04 | 21.59 million |
| 4 | Peloton Interactive | PTON | $ 2.441 billion | $ 6.89 | 9.28 million |
| 5 | Haliburton | HAL | $ 27.25 billion | $ 30.2 | 9.57 million |
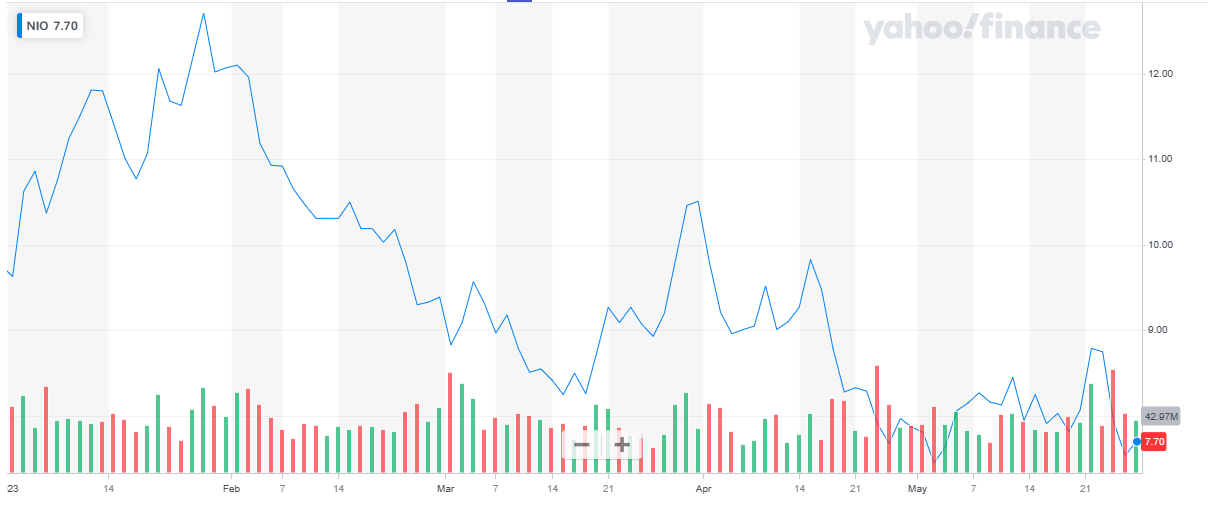
| 6 | Carnival Corporation & plc | CCL | $ 14.7 billion | $ 11.28 | 33.61 million |
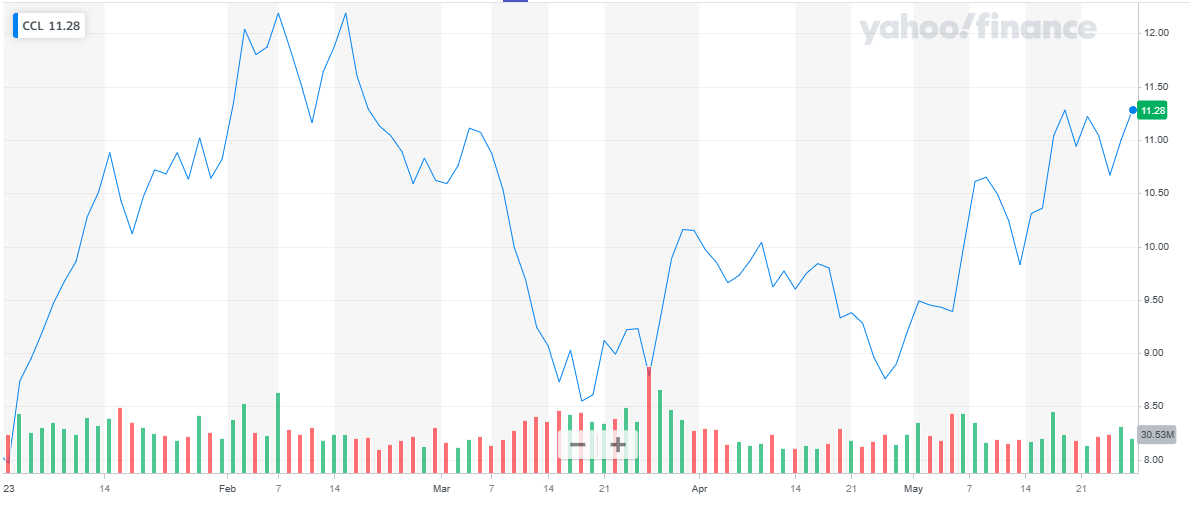
| 7 | NIO Inc. | NIO | $ 12.996 billion | $ 7.7 | 47.91 million |
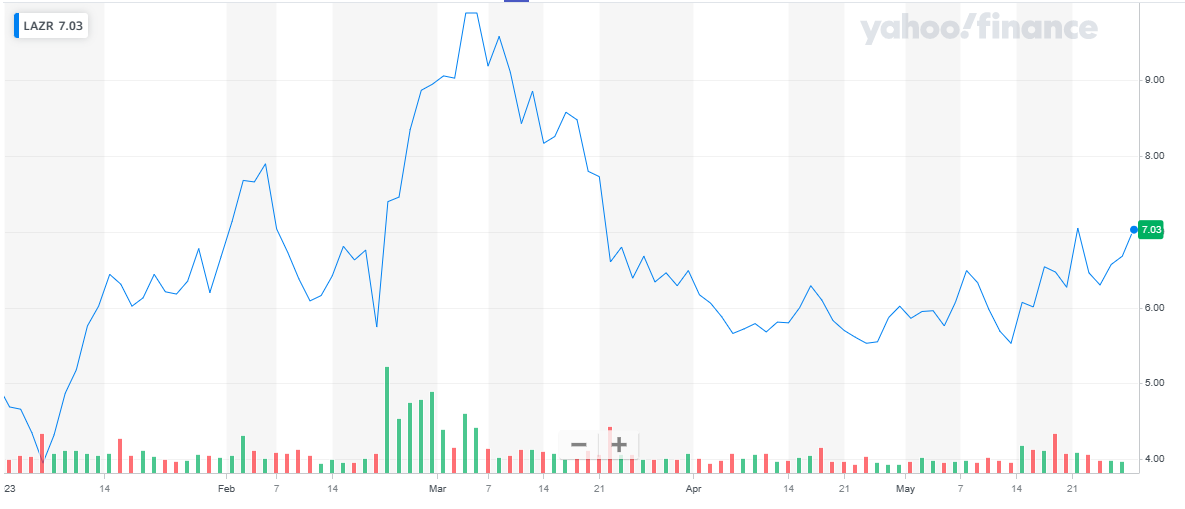
| 8 | Transocean Ltd | RIG | $ 4.752 billion | $ 6.2 | 11.95 million |
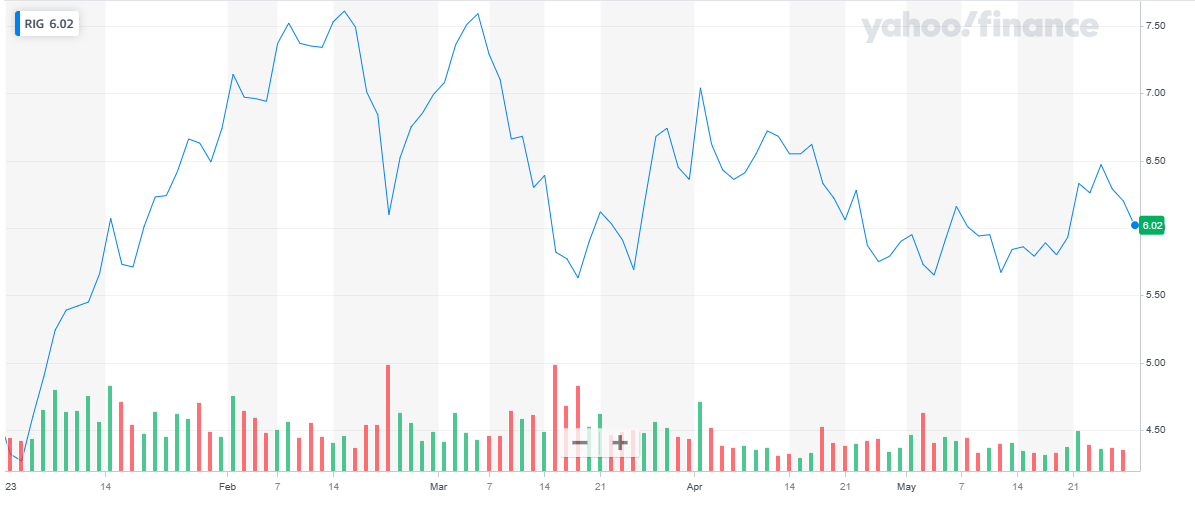
| 9 | Luminar Technologies | LAZR | $ 2.684 billion | $ 7.04 | 10.84 million |
| 10 | Advanced Micro Devices | AMD | $ 204.6 billion | $ 127.03 | 76.55 million |
 Tesla Inc.
Tesla Inc (Tesla) is an automotive and energy company. It designs, develops, manufactures, sells, and leases electric vehicles and energy generation and storage systems. The company produces and sells the Model Y, Model 3, Model X, Model S, Cybertruck, Tesla Semi, and Tesla Roadster vehicles. Tesla also installs and maintains energy systems and sells solar electricity; and offers end-to-end clean energy products, including generation, storage, and consumption. It markets and sells vehicles to consumers through a network of company-owned stores and galleries. The company has manufacturing facilities in the US, Germany, and China and has operations across the Asia Pacific and Europe. Tesla is headquartered in Austin, Texas, the US.
Tesla has a market cap of $ 612.25 billion. Its shares are trading at $ 192. In the past year, Tesla’s stock 52-week change is -23.5 %.
The average traded volume of the stock is:
| Average Volume – 3 months | 132.56 million |
| Average Volume – 10 day | 126.01 million |
Tesla stock started the year 2023 at $ 123.18. After an initial spike in price, the stock of Tesla has managed to maintain its price level. The stock last closed at $ 192 representing a 56 % stock appreciation to date.
The below chart shows the year-to-date performance of Tesla’s stock
 Carvana
Carvana Co. (Carvana) is an e-commerce platform to buy and sell used cars. The company offers different variants of used cars including sedans, SUVs, wagons, coupes, convertibles, hatchbacks, minivans, and trucks. It allows customers to research and identify a vehicle and inspect vehicles using its patented 360-degree vehicle imaging technology. Carvana also offers vehicle financing, vehicle warranty coverage, vehicle service contracts, automated vehicle valuations, and GAP waiver coverage. The company operates inspection and reconditioning centers (IRCs) in Georgia, New Jersey, Texas, Oklahoma, Arizona, Alabama, North Carolina, Ohio, California, Florida, Indiana, Utah, Virginia, and Arkansas. Carvana is headquartered in Tempe, Arizona, the US.
Carvana Co has a market cap of $ 2.085 billion. Its shares are trading at $ 11.74. In the past year, Carvana’s stock 52-week change is -60.12 %.
The average traded volume of the stock is:
| Average Volume – 3 months | 15.11 million |
| Average Volume – 10 day | 14.94 million |
Carvana stock started the year 2023 at $ 4.74. Initially, the stock started to rise and peaked at $ 14.45. From here on the stock declined. After another price rise, the stock eventually closed at $ 11.96 representing a 152 % stock appreciation to date.
The below chart shows the year-to-date performance of Carvana’s stock.
 Also read:
- Best day trading stocks
- Best stock advisor service
- Best forex indicators
- Best preferred stocks
- Best penny stocks to invest in
- Best crypto day trading strategies
Meta Platforms
Meta Platforms Inc (Meta), formerly Facebook Inc, is a provider of social networking, advertising, and business insight solutions. Through its major products Facebook, Instagram, Oculus, Messenger, and WhatsApp, the company connects people with their friends, families, and co-workers across the world, and helps them discover new products and services from local and global businesses. Meta sells advertising placements for marketers to reach people based on various factors including age, gender, location, interests, and behavior. The company has a business presence across the Americas, Europe, the Middle East, Africa, and Asia-Pacific. Meta is headquartered in Menlo Park, California, the US.
Meta Platforms has a market cap of $ 671.54 billion. Its shares are trading at $ 262.04. In the past year, Meta’s stock 52-week change is 35.32 %.
The average traded volume of the stock is:
| Average Volume – 3 months | 25.39 million |
| Average Volume – 10 day | 21.59 million |
Meta stock started the year 2023 at $ 120.34. The stock started with a bullish run and continued with this pattern to date. The stock last closed at $ 262.04, representing a 118 % appreciation.
The below chart shows the year-to-date performance of Meta stock:
 Peloton Interactive
Peloton Interactive Inc (Peloton Interactive), formerly Peloton Interactive LLC, offers bikes, tread, fitness apparel, and accessories. The company’s product portfolio comprises internet-connected stationary bikes, treadmills, cycling shoes, dumbbells, resistance bands, and fitness apparel. It also provides connected fitness subscriptions, access to live and on-demand fitness group classes at home that are led by its instructors, and the Peloton Digital app for household users to access its classes. Peloton Interactive sells its products directly to customers through a multi-channel sales platform that includes showrooms, inside sales, and e-commerce. The company has a presence in the US, Canada, the UK, Germany, and Australia. Peloton Interactive is headquartered in New York City, New York, the US.
Peloton Interactive Inc has a market cap of $ 2.441 billion. Its shares are trading at $ 6.89. In the past year, Peloton’s stock 52-week change is -50.64 %.
The average traded volume of the stock is:
| Average Volume – 3 months | 9.69 million |
| Average Volume – 10 day | 9.28 million |
Peloton stock started the year 2023 at $ 7.94. The stock started with a bullish run and peaked at $ 16.98. From here on the stock declined and last closed at $ 6.89 representing a 13.2 % decline to date.
The below chart shows the year-to-date performance of Peloton stock:
 Checkout:
- Best crypto signals
- Best undervalued stocks
- Best stock indicators
- Top trading blogs
- Best regional bank stocks
Haliburton
Halliburton Company provides products and services to the energy industry worldwide. It operates in two segments:
- Completion and Production – The Completion and Production segment offers production enhancement services that include stimulation and sand control services; cementing services, such as well bonding and casing, and casing equipment; completion tools that offer downhole solutions and services, including well completion products and services, intelligent well completions, and service tools, as well as liner hanger, sand control, and multilateral systems; production solutions comprising coiled tubing, hydraulic workover units, downhole tools, and pumping and nitrogen services; and pipeline and process services, such as pre-commissioning, commissioning, maintenance, and decommissioning
- Drilling and Evaluation – The Drilling and Evaluation segment offers to drill fluid systems, performance additives, completion fluids, solids control, specialized testing equipment, and waste management services; oilfield completion, production, and downstream water and process treatment chemicals and services; drilling systems and services; wireline and perforating services consists of open-hole logging, and cased-hole and slackline; and drill bits and services comprising roller cone rock bits, fixed cutter bits, hole enlargement, and related downhole tools and services, as well as coring equipment and services.
Halliburton Company was founded in 1919 and is based in Houston, Texas.
Halliburton Company has a market cap of $ 27.25 billion. Its shares are trading at $ 30.2. In the past year, the Halliburton Company’s stock 52-week change is -25.43 %.
The average traded volume of the stock is:
| Average Volume – 3 months | 9.69 million |
| Average Volume – 10 day | 9.57 million |
Halliburton Company stock started the year 2023 at $ 39.35. After a small rise in price, the stock continues to decline to date. It last closed at $ 27.25 representing a 31 % decline to date
The below chart shows the year-to-date performance of Halliburton Company stock:
 Carnival Corporation & plc
Carnival Corporation & Plc (Carnival) is a leisure travel company. It is a provider of extraordinary vacations to all major cruise destinations in the world. Carnival provides services through a portfolio of global, regional, and national cruise brands that specializes in selling cruise products, services, and vacation experiences. The cruise brand portfolio comprises Carnival Cruise Line, Princess Cruises, Holland America Line, Seabourn, AIDA Cruises, Costa Cruises, Cunard, P&O Cruises (Australia), and P&O Cruises (UK). The company also owns and operates Holland America Princess Alaska Tours, a tour operator in Alaska and the Yukon Territory of Canada. It operates in North America, Europe, Australia, and Asia. Carnival is headquartered in Miami, Florida, the US.
Carnival Corporation & Plc was founded in 1919 and is based in Houston, Texas.
Carnival Corporation & Plc has a market cap of $ 14.7 billion. Its shares are trading at $ 11.28. In the past year, the Carnival Corporation & Plc stock 52-week change is -18.73 %.
The average traded volume of the stock is:
| Average Volume – 3 months | 37.01 million |
| Average Volume – 10 day | 33.61 million |
Carnival Corporation & Plc stock started the year 2023 at $ 8.06. Initially, the stock price rose and peaked at $ 12.19. After that, the stock started to decline and eventually closed at $ 11.28, representing a 40 % appreciation to date
The below chart shows the year-to-date performance of Carnival Corporation & Plc stock:
 Also, read:
NIO Inc.
NIO Inc. is a pioneer in China’s premium smart electric vehicle market. NIO’s mission is to shape a joyful lifestyle by offering premium smart electric vehicles and being the best user enterprise. NIO designs jointly manufactures, and sells smart and connected premium electric vehicles, driving innovations in next-generation technologies in connectivity, autonomous driving, and artificial intelligence. Redefining the user experience, NIO provides users with comprehensive, convenient, and innovative charging solutions and other user-centric services. NIO began deliveries of the ES8, a 7-seater high-performance premium electric SUV in China in June 2018, and its variant, the six-seater ES8, in March 2019. NIO officially launched the ES6, a 5-seater high-performance premium electric SUV, in December 2018 and began deliveries in June 2019. NIO officially launched the EC6, a 5-seater smart premium electric Coupe SUV, in December 2019 and plans to commence deliveries in 2020.
NIO Inc has a market cap of $ 12.996 billion. Its shares are trading at $ 7.7. In the past year, the NIO Inc stock 52-week change is -55.72 %.
The average traded volume of the stock is:
| Average Volume – 3 months | 44.3 million |
| Average Volume – 10 day | 47.91 million |
NIO Inc stock started the year 2023 at $ 9.75. after an initial rise in price, the stock started its declining journey and continued to decline to date. The stock last closed at $ 7.7 representing a 21 % decline to date
The below chart shows the year-to-date performance of NIO Inc stock:
 Transocean Ltd
Transocean Ltd (Transocean) is a provider of offshore contract drilling services to the oil and gas sector. It specializes in the technically demanding regions of the global offshore drilling business with a particular focus on deepwater and harsh environment drilling services. The company’s fleet consists of different types of floaters, including ultra-deepwater, harsh environment, deepwater and midwater, and high-specification jackups. Its customer base includes international, government, and independent oil companies. It offers services to customers in North America, South America, Europe, and other regions. Transocean is headquartered in Steinhausen, Zug, Switzerland.
Transocean Ltd has a market cap of $ 4.752 billion. Its shares are trading at $ 6.2. In the past year, the Transocean Ltd stock 52-week change is 50.49 %.
The average traded volume of the stock is:
| Average Volume – 3 months | 18.03 million |
| Average Volume – 10 day | 11.95 million |
Transocean Ltd stock started the year 2023 at $ 4.56. The stock kicked off the year with a bullish run and continued to climb till it peaked at $ 7.61. After that the stock suffered multiple bumps and eventually closed the year at $ 6.2, representing an 18.55 % decline to date.
The below chart shows the year-to-date performance of Transocean Ltd Inc stock:
 Checkout:
- Best drone stocks
- Forex Signals providers
- Best NFT stocks
- Best swing trading stocks
- Technical analysis books
Luminar Technologies
Luminar Technologies, Inc., an automotive technology company, provides sensor technologies and software for passenger cars and commercial trucks in North America, the Asia Pacific, Europe, and the Middle East. It operates in two segments:
- Autonomy Solutions – The Autonomy Solutions segment designs, manufactures, and sells laser imaging, detection, and ranging sensors or lidars, as well as related perception and autonomy software solutions primarily for original equipment manufacturers in the automobile, commercial vehicle, robot-taxi, and adjacent industries
- Advanced Technologies and Services – The Advanced Technologies and Services segment develops application-specific integrated circuits, pixel-based sensors, and advanced lasers. This segment also designs, tests, and provides consulting services for non-standard integrated circuits for use in the automobile and aeronautics sector, as well as government spending in military and defense activities.
The company was founded in 2012 and is headquartered in Orlando, Florida.
Luminar Technologies has a market cap of $ 2.68 billion. Its shares are trading at $ 7.03. In the past year, the Luminar Technologies stock 52-week change is -35.4 %.
The average traded volume of the stock is:
| Average Volume – 3 months | 9.6 million |
| Average Volume – 10 day | 10.84 million |
Luminar Technologies stock started the year 2023 at $ 4.95. The stock kicked off the year with a bullish run and continued to climb till it peaked at $ 9.89. After that the stock continued to decline and eventually closed the year at $ 5.53, representing an 11.2 % appreciation to date.
The below chart shows the year-to-date performance of Luminar Technologies Inc stock:
 Advanced Micro Devices
Advanced Micro Devices Inc (AMD) designs, manufactures, develops, and markets high-performance computing, graphics, and visualization technologies. The company’s products portfolio includes:
- Desktop graphics
- Desktop processors
- Laptop graphics
- Laptop processors
- Chipsets
- Memory products
- Professional graphics
- Server processors
AMD markets its products under AMD, Athlon, EPYC, FreeSync, FirePro, Geode, Opteron, Ryzen, Radeon, Virtex, Kintex, Zynq, Versal, UltraScale, and Threadripper brand names. The company’s products find application in diverse areas, including automotive, aerospace and defense, healthcare and sciences, education, industrial and vision, consumer electronics, media and entertainment, and supercomputing and research. It serves OEMs, original design manufacturers, system integrators and independent distributors, add-in-board manufacturers, public cloud service providers, and other contract manufacturers. The company has a business presence across North America, Latin America, Europe, Asia-Pacific, and the Middle East. AMD is headquartered in Santa Clara, California, the US.
Advanced Micro Devices Inc has a market cap of $ 204.6 billion. Its shares are trading at $ 127. In the past year, AMD’s stock 52-week change is 24.71 %.
The average traded volume of the stock is:
| Average Volume – 3 months | 66.59 million |
| Average Volume – 10 day | 76.55 million |
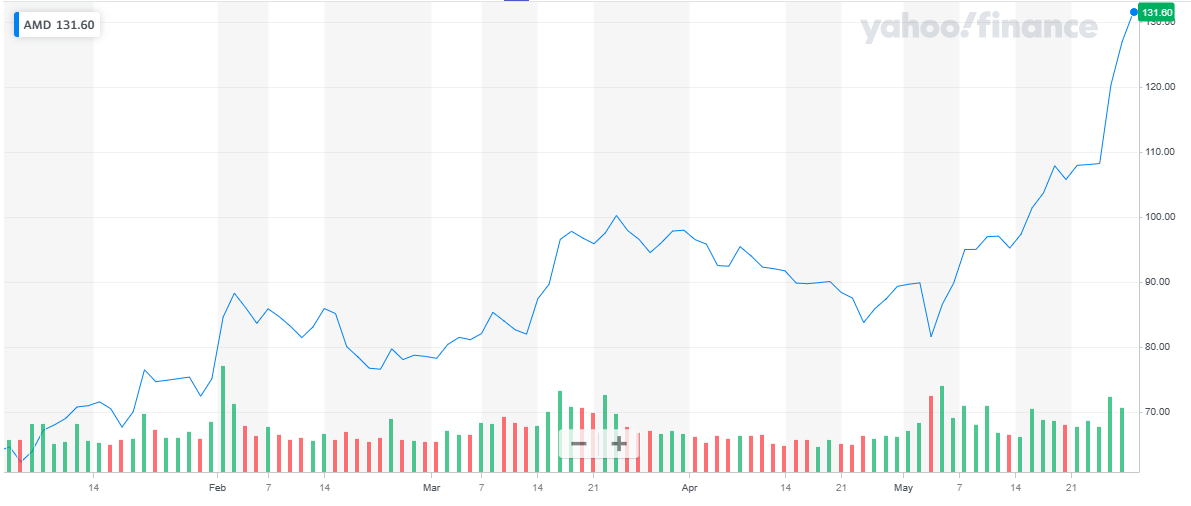
The stock of the company has been on a bullish run since the start of the year
The stock year to date’s performance is shown in this chart. The stock started the year 2023 at 64.77. It last closed at $ 127.03 representing a 96 % appreciation during the year.
 Conclusion
Day trading comes with the possibility of generating profits in a shorter duration, accessibility or ease of entry through the use of online-enabled trading platforms, and the availability of different strategies or techniques. However, some disadvantages arise from its inherent risks and limitations.
It is important to note, vigilant buying and selling is very important in this case. And it requires many skills, dedication, and time.
Also, learn:
- Top domestic stocks
- Best covered call stocks
- Best drip stocks
- Best stock signals
- Best stock forecast website
- Stocks vs Shares
