Relative Strength Index – Table of Contents
1.What is Relative Strength Index
2.Benefits of Relative Strength Index
3.Basic Relative Strength Index Strategies
4.Relative Strength Index as used by Elliott Wave Forecast
5.Relative Strength Index Trading strategies
6.RSI Settings for Day Trading
1.What is Relative Strength Index?
Relative Strength Index is a momentum oscillator that is used in technical analysis to quantify the speed and price movements of the stock or other assets. This indicator ranges between 0 to 100 and is used to identify overbought or oversold securities. Relative Strength Index is also used to identify the general trend.
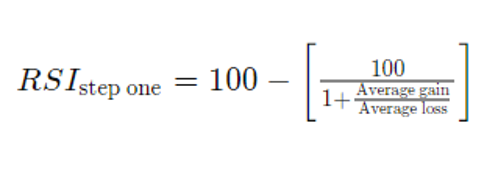
Relative Strength Index is calculated through Average Losses and Average Gains.
 .
.
Relative Strength Index is portrayed on a chart and is used to identify trends in the market. A value above 50 indicates an upward trend and a value below 50 indicated a downward trend. Learn about fibonacci retracement vs extension.
2.Benefits of Relative Strength Index
- Relative Strength Index lets you can predict the market conditions in advance. The trend line will break 3-4 days before the actual stock undergoes a shift in the ongoing trend enabling you to foresee the upcoming change.
- Relative Strength Index helps you achieve maximum profit and incur minimum losses. While using the Relative Strength Index to predict a particular stock, the indicator will breach the maximum and minimum price before the actual stock price drops or increases. This prevents you from incurring heavy losses and earn maximum profits.
- The mid-range 50 acts as a major guide in the Relative Strength Index to indicate the price direction. During the bullish trend, the index usually stays above 50 and during that bearish trend, the index stays below 50.
Read:
- Best Gold Trading Signal Providers.
- Top stock indicators for stock trading
- Best drone stocks
- Best Trading and Forex Signal Providers
3.Basic Relative Strength Index Strategies
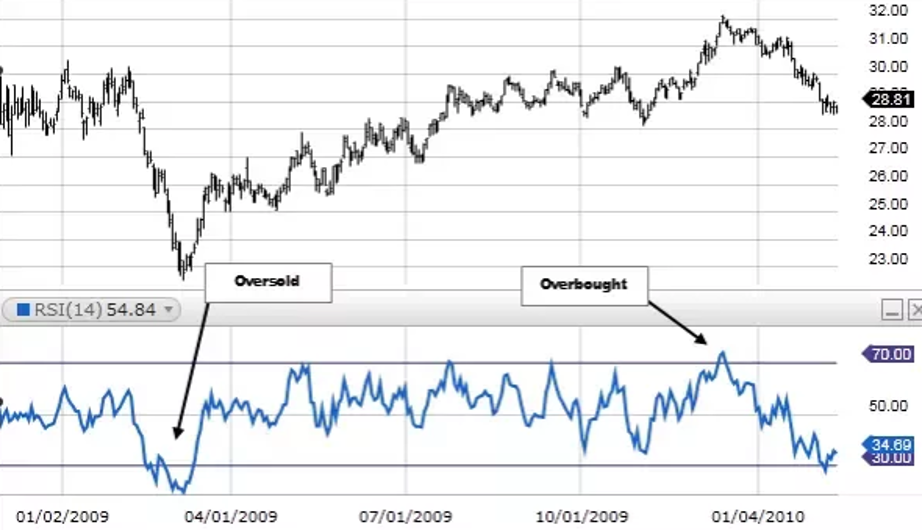
Relative Strength Index is the most renowned and reliable momentum indicator. Some traders find it hard to understand because of the infrequent trading signals. Relative Strength Index also helps identify oversold and overbought conditions in the market. A value of 30 and below indicates an oversold market and a value of 70 and above indicates an overbought condition.
- When the RSI rises above the level of 70, it is expected to drop. This gives the signal of a downward trend hence preparing the trader in advance
- When the RSI falls below the level of 30 it is expected to rise. This gives a signal that an upward trend is expected hence preparing the trader in advance.
- When the RSI crosses the 50 marks in an upward direction, it gives the signal that the prices will rise further
- When the RSI crosses the 50 marks in a downward direction, it gives the signal that the prices will drop further
In context with the above information, traders use the below mentioned trading strategies:
- Enter into a long position when RSI is around 30. The stock price is expected to rise
- Sell or short positions when RSI is around 70. The stock price is expected to fall
Also read: Best Stock Forecasts & Prediction Services
4.Relative Strength Index as used by Elliott Wave Forecast
At Elliott Wave Forecast, we don’t use RSI to determine overbought or oversold conditions or use it to enter trades and don’t use any other common RSI Trading Strategies. We mainly use RSI for the following purposes:
- To differentiate between an Impulsive and Corrective Elliott Wave Structure. Impulse structures should end with RSI divergence and corrective structures should end without RSI divergence.
- RSI trend line breaks as an indication a cycle is complete
- Use RSI to confirm various Elliott wave structures
Get to know the best covered call stocks to buy now.
5.Relative Strength Index Trading strategies
Centerline Crossovers
Relative Strength Index is also used to recognize price trends. When the indicator value crosses the 50 marks, it is signaling a new trend. There are two types of crossovers:
- Rising Centerline Crossover – When the RSI rises, crosses the 50 marks, and nears the range of 70, a bullish trend is recognized
- Falling Centerline Crossover – When the RSI drops, crosses the 50 marks, and nears the range of 30, a bearish trend is recognized
RSI Trendlines
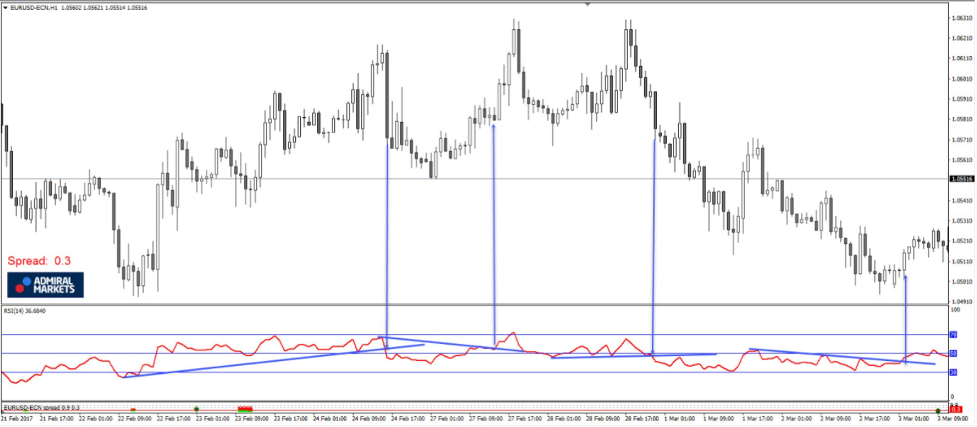
Relative Strength Index trendline is another strategy that signals price breaks. A break in the RSI trendline usually occurs before the break in the actual price chart. This is an indication of a potential reversal in price. It also guides you to weigh your trading strategy in line with the price changes. Furthermore, you as a trader get an opportunity to enter or exit.
Bitcoin is a digital currency distributed worldwide in which encryption techniques are used to regulate the generation of units of currency and verify the transfer of funds. Unlike traditional currencies such as dollars, bitcoins are issued and managed without any central authority whatsoever : there is no government, company, or bank in charge of Bitcoin.
Facebook likely will use crypto as a platform for payments, commerce, applications & gaming. With more than 2.5 billion users, the potential growth is tremendous. It will allow the users across Facebook, Messenger, Instagram, and Whatsapp to make digital payments.
An upward RSI Trendline is drawn by connecting three or more points in the index line as it rises. Similarly, a downward RSI Trendline is drawn by connecting three or more points on the index line as it falls. Learn about head and shoulders pattern
RSI Two Period Divergence
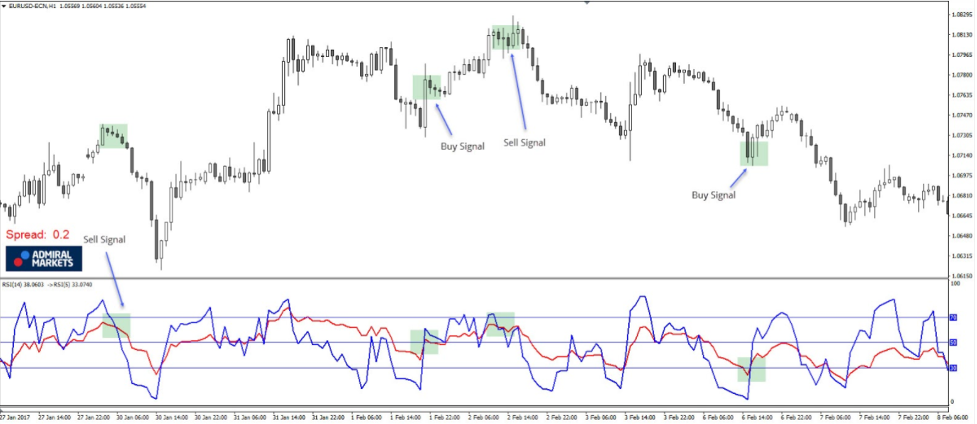
This strategy makes use of two different RSI based on different periods. For example, one long-term RSI, with a period of 14, and one short-term RSI, with a period of 5. It has been observed that many times the trend shifts even before the market reaches the oversold or overbought condition. A shorter RSI is more sensitive to price changes and gives early signs of reversal. When the shorter RSI crosses over the longer RSI, it signals the buy and sell opportunities.
Buy Signal-When the short-term RSI crosses above the long-term RSI, it indicates that prices are rising. This is a buy signal.
Sell/Short Signal– When the short-term RSI crosses below the long-term RSI, it indicates that prices are falling. This is a sell or short signal.
 Classic Divergence
This trading strategy enables you to identify divergences in the market that provides advanced signals of reversals. When the RSI is not in line with the stock’s price movements a reversal in trend is expected. This divergence in the index and stock price signal is where this trading strategy takes its name. There are both bullish and bearish divergences:
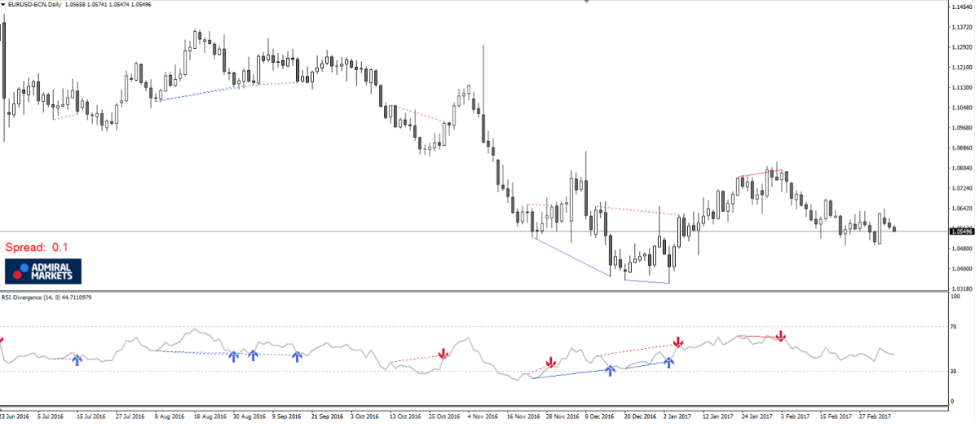 Bullish Divergence– A bullish divergence occurs when RSI indicates an oversold condition and the stock price shows a lower price. Such a situation signals the trader that trade is slow in terms of selling and prices are expected to rise. These bullish divergences give rise to long positions by traders. Also, as a trader, you should be cautious and understand that RSI tends to be misleading during strong trends. Multiple divergencies might occur during a strong downward trend even before the bottom is reached.
Bearish Divergence- A bearish divergence occurs when RSI indicates an overbought market condition and stock prices continue to rise. This situation indicates that buying momentum is slowing and the prices are expected to drop. These bearish divergences develop a trader’s interest in sell or short positions. Just like the bullish divergence, there might be multiple bearish divergences before the predicted pullback in price occurs.
RSI Swing Rejections
This trading strategy makes use of the Relative Strength Index only and disregards the price movements. By observing the index as it reaches the overbought and oversold conditions, this strategy can be an excellent predictor of an upcoming market reversal. There are both bullish and bearish swing rejections:
Bullish Swing Rejection- Also known as the Failure Swing Bottom, it occurs when the stock prices reach a lower low and RSI reaches a higher low and rises above the recent highest point reached. This is a bullish swing rejection and gives out a buying signal.
Bearish Swing Rejection- Also known as the Failure Swing Top, it occurs when stock prices reach a higher high and RSI makes a lower high and falls below the recent low point reached. This is the bearish swing rejection that gives out a sell signal. Get to know top signal providers.
Swing Rejections are also used as signals of trend reversals. You should use these signals to plan your entry or exit position.
RSI Scalping Strategy
Scalping trading strategy provides profits from small price changes. For scalping trading strategy to be beneficial, you should be very careful and should have a clearly defined exit strategy. The number of trades is very high and the profit percentage of each trade very low. An RSI scalping strategy is simple but has strict stops.
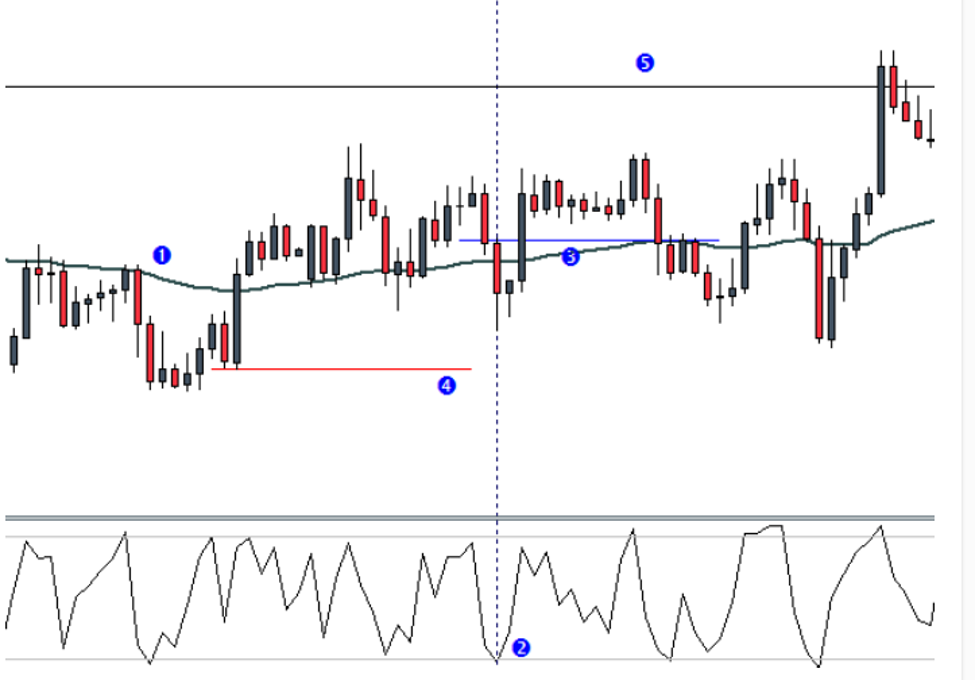
This strategy goes well with 2 period RSI and the overbought and oversold levels are set at 90 and 10. By setting a very small time for RSI, the smallest price changes are recorded. This strategy is coupled with Exponential Moving Average (EMA) where it is kept at a 55-period set to closing prices. When prices fall below the 55 EMA, you should seek short setups and prices are above the 55 EMA, you should look for long setups and using RSI as a trigger to execute the trade.
RSI Scalping Strategy – Long set up example
RSI scalping strategy is suitable in any time frame but it shows the best results in an intraday setting. A time of 30-minutes or 1 hour is the best time frame for this strategy.
Read more:
6. RSI Settings for Day Trading
Relative Strength Index is one of the most useful tools for day traders. As a day trader, you need different tools like RSI indicators to acquire beneficial trading set-ups as trading the most obvious stocks won’t earn enough profits.
Check out our list of best day trading stocks.
In day trading, you have to first establish your trading setup. This is done by assessing your support and resistance zones. Next review the market structure and give attention to the higher quality trading setups. A sensible approach would be to mark your support and resistance zones at the start of your trading. Then turn on the alerts for the Relative Strength index which will alert you about overbought or oversold conditions. And finally, you can assess the quality of the trading setup.
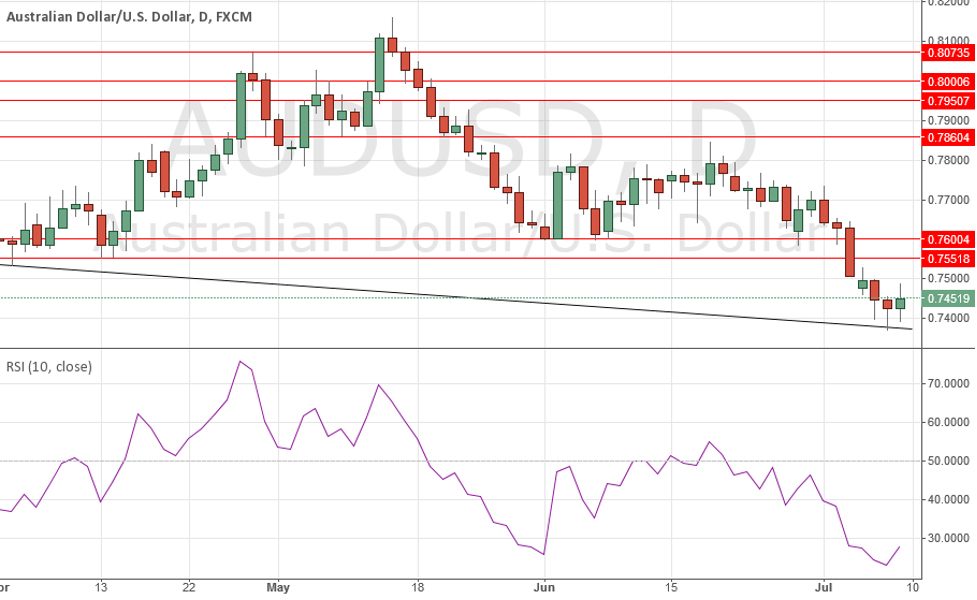
The key to making profits while using the Relative Strength Index is to set a time frame for your trading setup that matches your trading strategy. The standard time frame is the 14 period but we at Elliott Wave Forecast use 13 period by default due to 13 being a Fibonacci number. You can reduce it to a lower time frame of 9 if you are scalping and need a more sensitive index reading. If you are looking for short-term trades then a shorter period setting is preferred. Similarly, if you are looking for long-term trades then choose longer periods for the indicator.
As a day trader you should understand that it is not important to have a higher frequency of trades but what matters is the quality trades. With the Relative Strength Index, you get more time to analyze the whole picture of the trading floor and invest your time and effort in the quality trades.
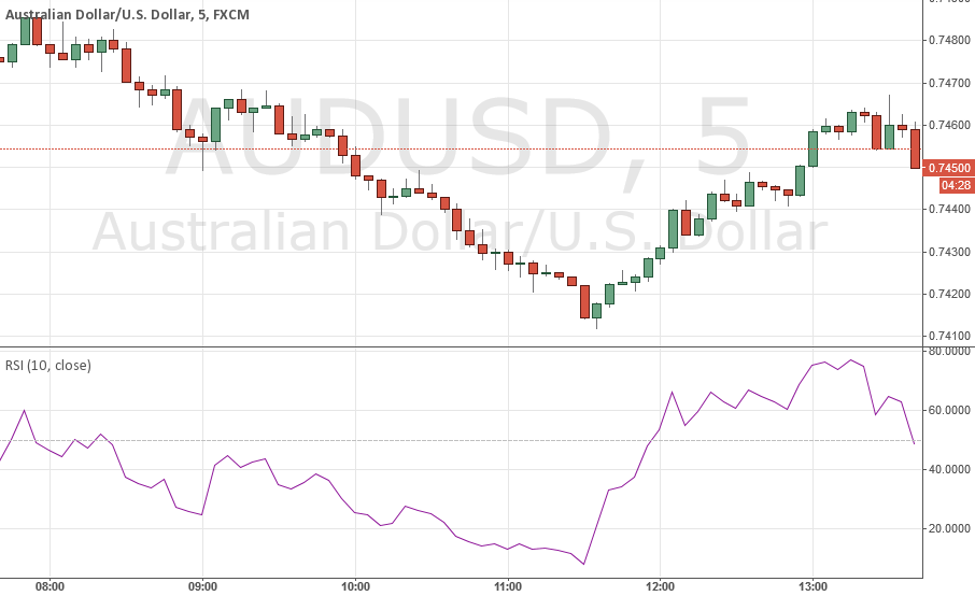
 RSI Settings for 5 Minute Chart
Conclusion
Relative Strength Index has multiple benefits but the primary benefit it provides is its versatility. It can be applied to currency, stocks, and commodities and will provide you with the same results. Like every indicator, the Relative Strength Index should be learned first before applying. Learning comes from experimenting. As a trader, you should invest your time to learn, experiment, test, and observe this index before applying it in actual trades
Once you understand the Relative Strength Indicator and learn to apply it correctly, it will be very beneficial in your trading.
BTCUSD has been showing incomplete impulsive sequences from the September 9834.4 low. Consequently we were calling for more strength in the Bitcoin, suggesting members to avoid selling it and keep buying the dips in 3,7,11 swings whenever get chance.
Disclaimer: None of the information published in this article should be construed as investment advice. Article is based on author’s independent research, we strongly advise our readers to always do their due diligence before investing.
You may also like reading:
