Mastering Elliott Wave pattern recognition is one of the most valuable skills a trader can develop when analyzing financial markets. The Elliott Wave Principle is built on the idea that markets move in repetitive cycles driven by investor psychology and collective sentiment. These recurring patterns can help traders identify trend direction, anticipate reversals, and understand where the market may move next. However, successfully applying Elliott Wave Theory requires more than simply memorizing wave structures. It demands patience, market awareness, and the ability to recognize how price behavior reflects crowd psychology in real-time.
Understanding the Psychology Behind Elliott Waves
One of the most important aspects of Elliott Wave analysis is understanding that every wave reflects a different emotional stage of the market. Each wave carries its own personality, which is shaped by fear, optimism, greed, uncertainty, or panic among market participants. Traders who learn to recognize these emotional transitions often gain a stronger understanding of overall market structure rather than reacting emotionally to short-term price fluctuations.
The market typically moves in a five-wave impulse sequence during the dominant trend, followed by a three-wave corrective structure. These patterns repeat across multiple timeframes due to the fractal nature of financial markets. Understanding these repeating behaviors allows traders to analyze both short-term and long-term market conditions with greater confidence.
Recognizing the Five-Wave Impulse Structure
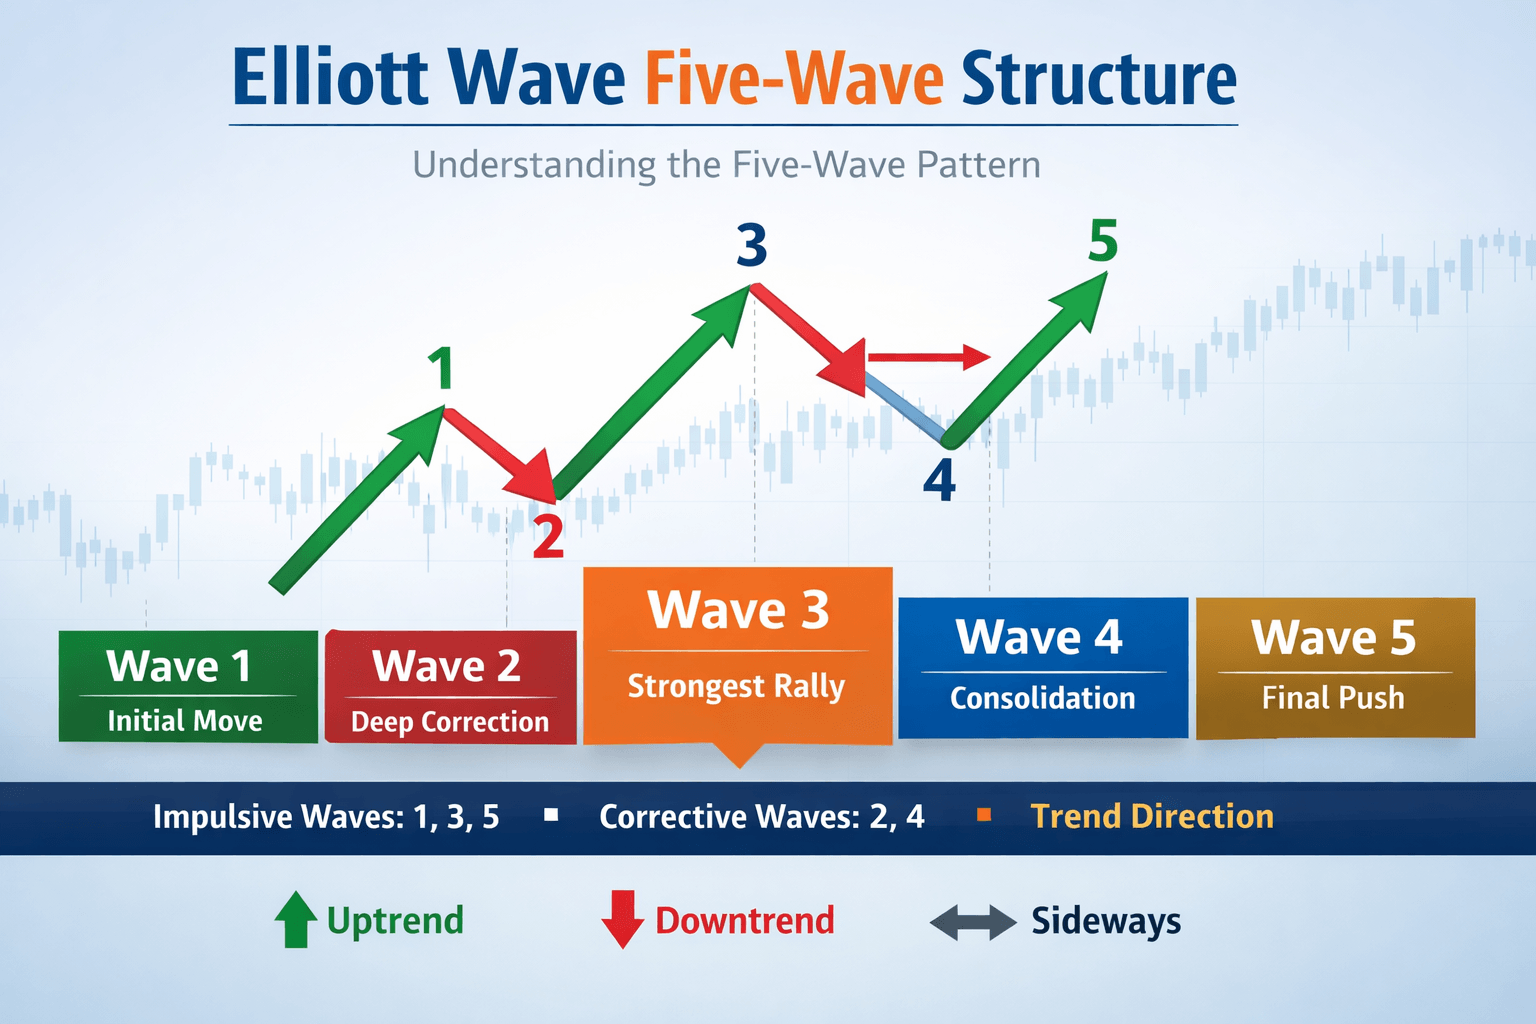
Wave 1 – The Beginning of a New Trend
Wave 1 is often difficult to identify because market sentiment usually remains strongly aligned with the previous trend. In a newly forming bullish market, for example, news headlines may still appear negative and investors remain cautious. Volume may slightly increase, but not enough to convince most traders that a new trend has started. This stage is typically driven by early participants who recognize potential changes before the majority of the market reacts.
Wave 2 – The Doubt Phase
Wave 2 retraces part of Wave 1 and often creates uncertainty among traders. Many investors believe the previous trend is resuming, which causes bearish sentiment to return quickly. However, Wave 2 usually retraces less than 61.8% of Wave 1 and often develops in a three-wave corrective structure. Lower trading volume during this phase can also indicate that the prior trend is weakening.
Wave 3 – The Strongest Wave
Wave 3 is commonly the most powerful and extended wave in the entire impulse sequence. During this phase, market confidence begins to grow rapidly as prices move aggressively in the direction of the trend. News becomes increasingly positive, analysts revise forecasts, and traders who waited for pullbacks often miss the move entirely. Wave 3 frequently extends to 1.618 times the length of Wave 1, making Fibonacci relationships extremely important in Elliott Wave analysis.
Wave 4 – The Consolidation Phase
Wave 4 typically appears as a sideways correction after the strong momentum of Wave 3. The market may consolidate for an extended period, frustrating traders expecting another immediate breakout. Volume often declines significantly during this stage, while price retracements usually remain relatively shallow compared to the strength of Wave 3 of 5 wave structure. This phase often provides experienced traders with opportunities to prepare for the final impulse move.
Wave 5 – The Final Push
Wave 5 represents the final stage of the dominant trend. At this point, optimism becomes widespread and market participation increases significantly. Ironically, this is often where inexperienced traders enter the market late in the cycle. Momentum indicators may begin showing divergence, meaning prices continue making new highs while momentum weakens. This divergence can serve as an important warning sign that the trend is nearing exhaustion.

Understanding Corrective Wave Structures
After the five-wave impulse sequence completes, the market generally enters a corrective phase labeled A, B, and C. Corrective structures can be more difficult to identify because they often contain overlapping price action and inconsistent momentum.
Wave A usually catches traders off guard because many participants still believe the dominant trend remains intact. Volume may begin increasing while volatility rises gradually. During Wave B, prices temporarily recover, giving traders false confidence that the original trend is returning. Finally, Wave C tends to move aggressively in the opposite direction and often resembles an impulse wave itself. By this stage, most market participants recognize that a broader correction or trend reversal is underway.
The Role of Fibonacci Ratios in Elliott Wave Analysis
Fibonacci ratios play a critical role in identifying Elliott Wave structures. Many wave relationships are measured using Fibonacci retracement and extension levels, helping traders estimate possible reversal zones and price targets. Common Fibonacci relationships include:
- Wave 2 retracing 50% to 61.8% of Wave 1
- Wave 3 extending 1.618 times Wave 1
- Wave 4 retracing approximately 38.2% of Wave 3
- Wave C extending equal to or greater than Wave A
These mathematical relationships help traders improve accuracy when forecasting future price movements and identifying high-probability setups.
Detecting Elliott Waves Using Fractals and Momentum Indicators
Modern Elliott Wave analysis often incorporates technical indicators to improve wave detection and reduce subjectivity. Two commonly used tools are the Fractal Indicator and the Awesome Oscillator. These tools help traders identify potential wave turning points and momentum shifts more effectively.
The Fractal Indicator helps detect local highs and lows within market structure. Up fractals are typically associated with impulse wave points 1, 3, and 5, while down fractals are used for corrective wave points 2 and 4. However, not every fractal qualifies as a valid wave point. Traders must also confirm a change in trend direction before validating the wave structure.
The Awesome Oscillator assists by measuring momentum changes within the trend. When momentum begins shifting alongside fractal formations, traders gain additional confirmation that a wave transition may be occurring. Combining fractal analysis with momentum confirmation can significantly improve wave counting accuracy and reduce false signals.
Market Fractality and Multi-Timeframe Analysis
One of the defining characteristics of Elliott Wave Theory is market fractality. Price patterns repeat across all timeframes, meaning smaller wave structures combine to form larger wave patterns. This allows traders to analyze the market from both short-term and long-term perspectives simultaneously.
For example, a five-wave impulse pattern on a lower timeframe may only represent a single wave within a larger structure on a higher timeframe. Understanding this relationship is essential for aligning trades with the dominant market trend and avoiding trades that move against broader momentum.
Reducing Subjectivity in Wave Counts
One of the biggest criticisms of Elliott Wave Theory is the subjectivity involved in wave counting. Different analysts may interpret the same chart differently, leading to conflicting forecasts. However, traders can reduce subjectivity by strictly following the core rules of wave formation and combining Elliott Wave analysis with additional technical tools such as Fibonacci retracements, oscillators, trend analysis, and support and resistance zones.
Consistent practice also plays a major role in improving wave recognition skills. Studying historical market structures, reviewing completed wave counts, and participating in trading communities can help traders refine their analytical approach over time.
Final Thoughts
Elliott Wave Theory remains one of the most sophisticated methods for understanding market behavior and investor psychology. By learning how to recognize impulse and corrective structures, traders can better anticipate trend continuation, reversals, and potential breakout opportunities. Although wave counting can initially appear complex, combining Elliott Wave principles with Fibonacci ratios, fractal analysis, and momentum indicators can significantly improve consistency and confidence in market analysis.
The key to mastering Elliott Wave pattern recognition lies in patience, discipline, and continuous observation of price behavior across multiple timeframes. Traders who develop these skills can gain a deeper understanding of market structure and position themselves more effectively in dynamic trading environments.


