


Elliott Wave Theory is one of the most powerful forms of technical analysis used to understand market psychology and forecast future price movements. Developed by Ralph Nelson Elliott, the theory suggests that financial markets move in recurring wave patterns driven by investor emotions, crowd psychology, and cyclical behavior.
By identifying these repeating wave structures and combining them with Fibonacci ratios, traders can recognize trends, reversals, and high-probability trading opportunities. Elliott Wave analysis is widely used across Forex, stocks, commodities, indices, and cryptocurrency markets because of its ability to map market structure across multiple timeframes.
In this guide, we explain how to identify Elliott Wave impulse and corrective patterns, understand wave personalities, use fractal analysis and Awesome Oscillator for wave detection, and reduce subjectivity in wave counting for more accurate market analysis.
What is Elliott Wave Theory?
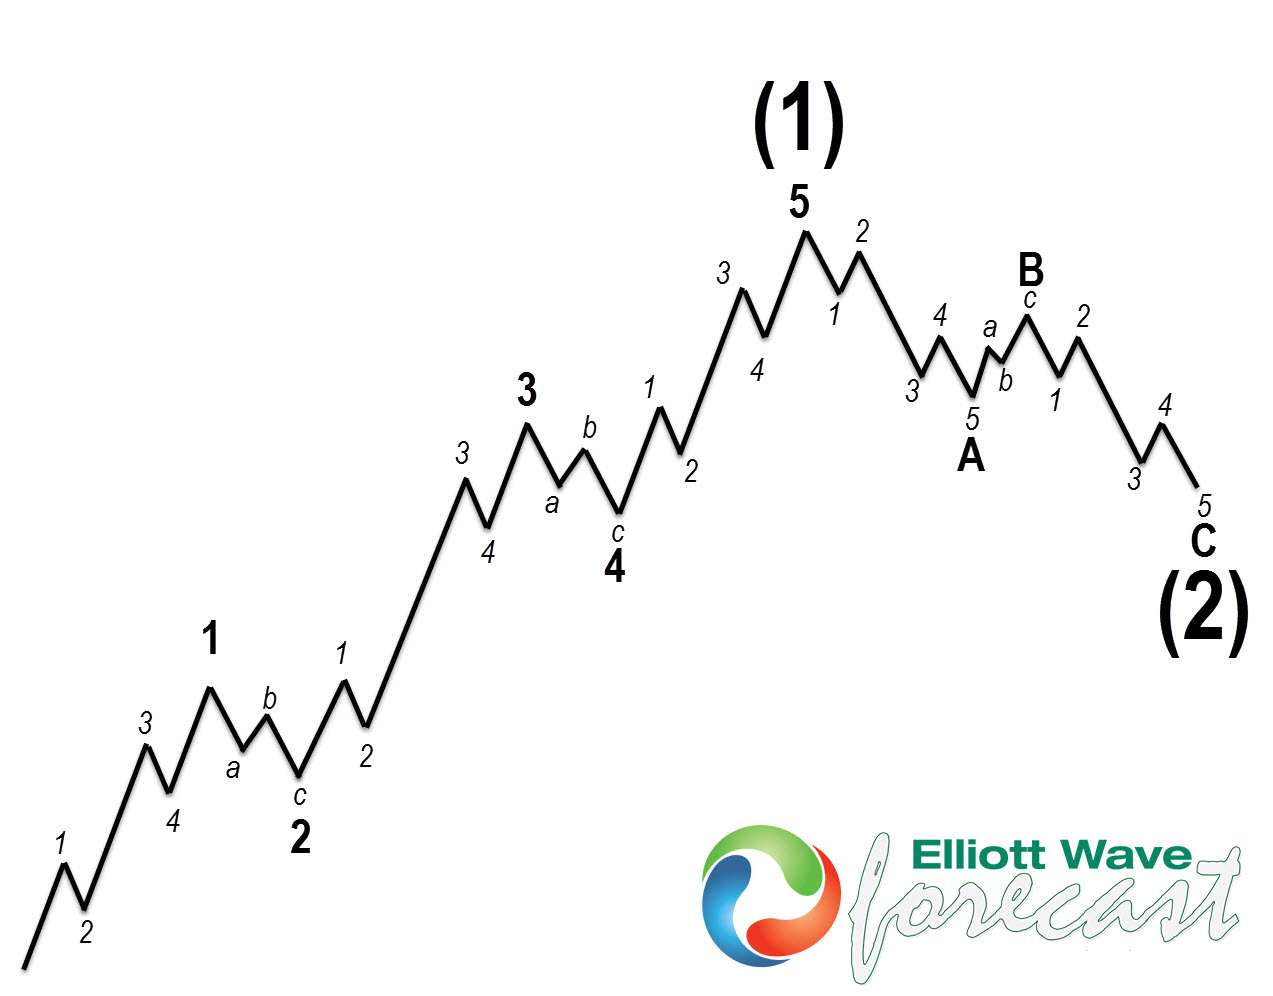
Elliott Wave Theory explains that financial markets move in repetitive wave cycles driven by collective investor psychology. These market cycles are typically structured into five-wave impulse patterns and three-wave corrective patterns. Impulse waves move in the direction of the dominant trend, while corrective waves move against it as temporary pullbacks or consolidations. The theory is closely tied to Fibonacci Sequence mathematics, as wave relationships frequently align with key Fibonacci retracement and extension levels such as 38.2%, 50%, 61.8%, and 161.8%. By understanding these wave structures and Fibonacci relationships, traders can better identify potential reversal zones, continuation opportunities, and probable price targets within the market.
Understanding the 5-Wave Impulse Structure
An impulse wave consists of five waves moving in the direction of the dominant trend. These waves are labeled:
1, 2, 3, 4, and 5
Waves 1, 3, and 5 move with the trend, while waves 2 and 4 are corrective pullbacks.
Wave 1 – The Beginning of a New Trend
In Elliott Wave Theory, Wave 1 is often the most difficult phase to recognize in real time because overall market sentiment is still heavily influenced by the previous trend. During this stage, news sentiment typically remains negative, most traders continue to hold bearish expectations, and many technical analysts dismiss the initial upward movement as only a temporary bounce. Although trading volume may begin to increase slightly, market participation usually remains limited due to low confidence among investors. Wave 1 therefore represents the early transition from the previous bearish trend into the beginning of a potential new bullish cycle, laying the foundation for the larger impulsive structure that may follow.
Wave 2 – The Corrective Pullback
In Elliott Wave Theory, Wave 2 retraces a portion of Wave 1 but never declines beyond the starting point of Wave 1, which is one of the core rules of the theory. During this phase, bearish sentiment quickly returns as market participants begin to believe that the previous downtrend is resuming. News and overall market outlook generally remain pessimistic, reinforcing negative expectations among traders. Wave 2 corrections commonly retrace up to the 61.8% Fibonacci Sequence level of Wave 1 and usually unfold in a three-wave corrective structure. Trading volume during this phase is typically lower than in Wave 1, reflecting weaker selling pressure and uncertainty within the market before the larger bullish trend potentially continues.
Wave 3 – The Strongest Momentum Wave
In Elliott Wave Theory, Wave 3 is typically the strongest and most extended wave within the trend, characterized by powerful bullish momentum and rapid price acceleration. During this phase, trading volume usually increases significantly as institutional participation rises and market confidence strengthens. Positive economic news and optimistic sentiment begin dominating headlines, encouraging more traders to enter the market. Unlike earlier phases, pullbacks during Wave 3 are often shallow because buying pressure remains strong throughout the move. In many cases, Wave 3 extends to approximately 1.618 times the length of Wave 1, reflecting the influence of the Fibonacci Sequence in wave relationships. This is also the stage where the majority of traders finally recognize that a new bullish trend is underway, leading to broad market participation and strong trend continuation.
Wave 4 – Consolidation Phase
Wave 5 – Final Trend Expansion
In Elliott Wave Theory, Wave 5 represents the final impulsive move before the market enters a larger corrective phase. During this stage, public optimism usually becomes extremely strong, bullish news headlines dominate financial media, and retail participation increases significantly as more traders rush into the trend. Although prices may continue pushing to new highs, underlying momentum often begins to weaken. Technical indicators such as RSI or MACD frequently show bearish divergences, where momentum fails to confirm the new price highs, signaling that the trend may be losing strength. Trading volume during Wave 5 can also weaken compared to the powerful participation seen in Wave 3, suggesting reduced institutional buying pressure. These conditions often indicate that the market is approaching the end of the broader impulsive cycle and that a larger corrective structure may soon begin.
 Understanding Corrective ABC Waves
After a five-wave impulse sequence completes, the market generally enters a corrective phase labeled:
A, B, and C
Corrective waves move against the dominant trend and can appear in various structures.
Wave A
Wave A is the first move against the dominant trend.
Typical characteristics:
- Traders often mistake it for a temporary pullback
- Market sentiment may still remain bullish
- Volume can increase
- Volatility may rise
Most traders do not initially recognize the beginning of a larger correction.
Wave B
Wave B temporarily reverses the decline from Wave A.
Characteristics include:
- False optimism returns
- Many traders believe the bull trend has resumed
- Volume remains weaker
- Momentum indicators fail to confirm strength
Wave B often traps traders before the stronger Wave C decline begins.
Wave C
Wave C is typically the strongest corrective wave.
Key characteristics:
- Five-wave impulsive decline
- Strong bearish sentiment
- High volatility
- Increasing trading volume
- Panic selling
Wave C often equals Wave A in size or extends to 1.618 times Wave A.

Elliott Wave Detection Methods
Identifying Elliott Waves in real-time is challenging because wave structures are highly dynamic and sometimes subjective.
Several detection approaches are commonly used.
Mono-Wave Classification
In Elliott Wave Theory, Mono-Wave Classification is a method that focuses on identifying and analyzing smaller wave segments individually rather than evaluating the entire market structure at once. The process involves identifying different wave scales, separating mono-wave structures, applying Fibonacci Sequence ratio rules, and examining the relationships between neighboring waves to determine pattern consistency. By analyzing waves in isolation, traders can build a more detailed understanding of market behavior and improve wave count accuracy. However, this approach is highly computationally intensive and often requires significant experience, as the complexity of wave relationships and varying market conditions can make classification difficult for inexperienced analysts.
Large Pattern Decomposition
In Elliott Wave Theory, the Top-Down Wave Analysis approach begins by identifying larger market structures before breaking them down into smaller wave formations. This method helps traders understand the broader market context first, making it easier to recognize dominant impulse structures and overall trend direction. By focusing on higher-degree wave patterns initially, analysts can perform faster large-scale pattern analysis and improve trend identification across multiple timeframes. The approach is especially useful for detecting major bullish or bearish cycles before examining lower-degree internal wave movements. However, one limitation of this method is that corrective structures are often more complex and difficult to identify accurately, since corrections can develop in irregular or overlapping formations that may not be immediately visible from a top-down perspective.
Significant Pattern Recognition
In Elliott Wave Theory, Selective Wave Analysis focuses on identifying only the most significant wave formations instead of labeling every individual market movement. This approach prioritizes major trend structures and high-probability wave setups while filtering out smaller, less meaningful fluctuations that often create noise and confusion. By concentrating on the most relevant patterns, traders can achieve faster processing, improved analytical efficiency, and a more practical framework for real-world market analysis. The method also helps reduce overcomplication, which is a common challenge in detailed wave counting. Because of its balance between accuracy and simplicity, Selective Wave Analysis is considered one of the more effective approaches for modern market analysis, especially in fast-moving financial environments.
Detecting Elliott Waves with Fractals and Awesome Oscillator
Fractal is one of the core foundations of Elliott Wave Theory, as wave structures tend to repeat across multiple timeframes and create nested market patterns. This means that similar impulsive and corrective formations can appear on both short-term and long-term charts, reflecting recurring patterns in investor psychology and market behavior. To improve wave detection and increase analytical accuracy, traders often combine Elliott Wave analysis with tools such as fractal indicators, the Awesome Oscillator, broader trend analysis, and Fibonacci Sequence ratios. By integrating these tools, traders can better identify momentum shifts, trend continuation zones, and possible reversal points. In many cases, the initial five impulse wave points can be recognized through the appearance of fractal formations alongside strengthening momentum signals.
Using Fractals for Wave Detection
In Elliott Wave Theory, fractals are commonly used to help identify potential turning points in market price action and improve wave recognition accuracy. To detect impulsive Waves 1, 3, and 5, traders generally look for up fractals combined with confirmation of a bullish trend reversal or momentum shift. In contrast, identifying corrective Waves 2 and 4 typically requires down fractals along with confirmation that the market is temporarily changing direction within the broader trend structure. These fractal signals help traders visually locate possible wave highs and lows across different timeframes. However, not every fractal automatically qualifies as a valid Elliott Wave turning point. All identified wave structures must still follow the core rules and guidelines of Elliott Wave analysis, including proper wave sequencing, non-overlapping conditions, and valid Fibonacci Sequence relationships between waves.
Using Awesome Oscillator for Trend Confirmation
The Awesome Oscillator is widely used alongside Elliott Wave Theory to help confirm momentum shifts and improve wave interpretation. The indicator assists traders by confirming overall trend direction, identifying periods of momentum acceleration, spotting bullish or bearish divergences, and recognizing potential wave completion zones. During strong impulsive phases such as Wave 3, the oscillator often shows expanding momentum, while weakening histogram strength or divergence can indicate that a trend may be approaching completion, particularly during Wave 5. Traders also use the Awesome Oscillator to distinguish between impulsive and corrective price action by comparing momentum behavior across wave structures. When combined with Fractal analysis, oscillator confirmation can significantly improve wave-count accuracy by filtering false signals and providing additional confirmation for potential turning points and trend reversals.
The Role of Fibonacci Ratios in Elliott Wave Analysis
Fibonacci relationships are essential in Elliott Wave Theory because waves often expand and retrace according to Fibonacci mathematics.
Common relationships include:
- Wave 2 retraces 50%–61.8% of Wave 1
- Wave 3 commonly extends 161.8% of Wave 1
- Wave 4 retraces around 38.2% of Wave 3
- Wave C often equals or extends 161.8% of Wave A
These ratios help traders estimate:
- Entry zones
- Profit targets
- Reversal areas
- Stop-loss placements
Subjectivity in Elliott Wave Counts
One of the biggest criticisms of Elliott Wave Theory is subjectivity.
Different analysts may interpret the same chart differently because:
- Markets are complex
- Multiple valid counts may exist
- Corrections vary significantly
- Real-time analysis evolves constantly
Despite this, traders can reduce subjectivity by:
- Following strict Elliott Wave rules
- Using Fibonacci confirmation
- Combining indicators
- Applying multi-timeframe analysis
- Practicing consistent wave counting
Experience plays a major role in improving wave interpretation skills.
Best Technical Indicators to Combine with Elliott Wave Theory
Elliott Wave analysis becomes more reliable when combined with other technical tools.
Popular indicators include:
Relative Strength Index (RSI)
Used for:
- Divergence analysis
- Overbought/oversold conditions
- Momentum confirmation
MACD
Useful for:
- Trend confirmation
- Momentum analysis
- Detecting reversals
Awesome Oscillator
Helps identify:
- Momentum acceleration
- Trend shifts
- Wave strength
Fractals
Used for:
- Swing point identification
- Wave structure recognition
Volume Analysis
Important for:
- Confirming Wave 3 strength
- Spotting weakening Wave 5 momentum
Practical Elliott Wave Trading Strategies
Elliott Wave Theory can be used to identify high-probability trading opportunities.
Trend Continuation Entries
Many traders enter during:
- Wave 2 pullbacks
- Wave 4 consolidations
These areas often provide:
- Lower-risk entries
- Strong reward-to-risk setups
Using Fibonacci for Trade Planning
Traders commonly use Fibonacci retracement levels to:
- Plan entries
- Set targets
- Define stop-loss levels
Confluence between Fibonacci and wave structure improves trade quality.
Risk Management
Risk management remains essential because no wave count is guaranteed.
Important practices include:
- Using stop-loss orders
- Limiting position size
- Waiting for confirmation
- Avoiding emotional trading
Multi-Timeframe Analysis
Professional traders often analyze:
- Higher timeframe trend direction
- Lower timeframe entries
- Nested wave structures
This improves timing and overall accuracy.
Conclusion
Elliott Wave Theory provides traders with a structured framework for understanding market behavior, trend psychology, and recurring price patterns. By identifying impulse and corrective waves, traders can better anticipate future market direction and recognize high-probability trading setups.
The theory becomes even more effective when combined with:
- Fibonacci analysis
- Fractal indicators
- Momentum oscillators
- Volume analysis
- Multi-timeframe confirmation
Although Elliott Wave analysis contains some degree of subjectivity, disciplined practice and adherence to core principles can significantly improve wave recognition accuracy.
For traders willing to study market structure deeply, Elliott Wave Theory remains one of the most powerful tools for forecasting price action and understanding crowd psychology in financial markets.
FAQ
What is Elliott Wave Theory?
Elliott Wave Theory is a technical analysis method that identifies recurring market wave patterns driven by investor psychology and sentiment.
How do traders identify Elliott Waves?
Traders use wave structures, Fibonacci ratios, fractals, momentum indicators, and price action analysis to identify Elliott Wave patterns.
Which wave is usually the strongest?
Wave 3 is typically the strongest and longest impulse wave because momentum and participation increase significantly during this phase.
What indicators work best with Elliott Wave Theory?
Popular indicators include RSI, MACD, Fractals, Awesome Oscillator, Fibonacci retracements, and volume analysis.
Is Elliott Wave Theory accurate?
Elliott Wave Theory can be highly effective when combined with technical indicators, proper risk management, and disciplined analysis.
Can Elliott Wave Theory be used in crypto trading?
Yes. Elliott Wave Theory is widely used in cryptocurrency markets because crypto often displays strong emotional and cyclical price behavior


