List of Top Domestic Stocks
Here is the list of best domestic Stocks worth investing in 2024:
| Sr. | Company Name | Symbol | Price (As of 25th March 2023) | Market Cap |
| 1 | Chipotle Mexican Grill | CMG | $ 1,624 | $ 44.9 billion |
| 2 | Dollar General | DG | $ 205.81 | $ 46 billion |
| 3 | Eli Lilly | LLY | $ 336.13 | $ 320 billion |
| 4 | PINS | $ 27.47 | $ 18.8 billion | |
| 5 | ETSY | ETSY | $ 106.85 | $ 13.7 billion |
| 6 | Intuitive Surgical | ISRG | $ 256.42 | $ 89.8 billion |
| 7 | Block | SQ | $ 60.68 | $ 37.25 billion |
| 8 | Walgreens Boots Alliance | WBA | $ 32.7 | $ 28.2 billion |
| 9 | Aflac | AFL | $ 62.88 | $ 38.5 billion |
| 10 | Intel Corporation | INTC | $ 29.36 | $ 121.5 billion |
 Chipotle Mexican Grill (CMG)
Chipotle owns and operates more than 3,000 fast-casual restaurants serving made-to-order tacos, burritos, and bowls. The chain has locations in the U.S., Canada, France, Germany, and the U.K. All those locations are corporate-owned.
Chipotle Mexican Grill reported its full-year results for 2022:
| 2022 | 2021 | Percentage change | |
| Revenues | $ 8,635 million | $ 7,547 million | 14.4 % |
| Income from Operations | $ 1,160 million | $ 805 million | 44 % |
| Net Income | $ 899 million | $ 653 million | 38 % |
| Earnings per share | $ 32.28 | $ 23.21 | 39 % |
- Revenues reported a net increase of 14.4 % in 2022 as compared to the previous year
- Income from Operations reported a net increase of 44 % in 2022 as compared to the previous year
- Net Income reported a net increase of 38 % in 2022 as compared to the previous year
- Earnings per share reported a net increase of 39 % in 2022 as compared to the previous year
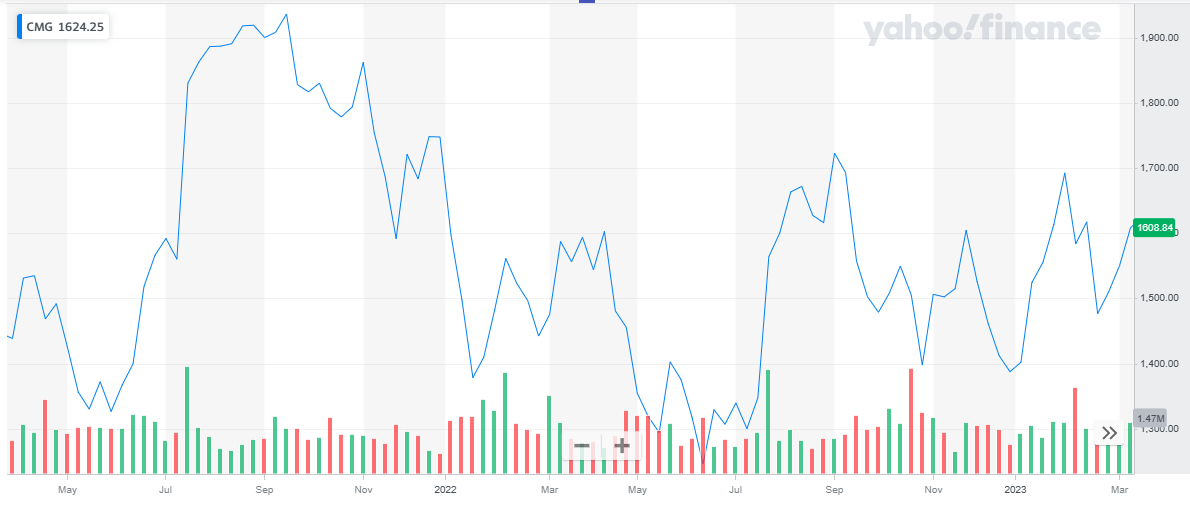
Chipotle Mexican Grill has a market cap of $ 44.9 billion. Its shares are trading at $ 1,624.
The stock started the year 2022 at $ 1,748. It started off with a bearish run and drooped as low as $ 1,245. After that, the stock recovered and closed off the year at $ 1,387 representing a 20.6 % decline during the year.
In 2023, the stock went bullish and has appreciated by 17.1 % to date.
 Also, learn:
- Best covered call stocks
- Best drip stocks
- Best stock signals
- Best stock forecast website
- Stocks vs Shares
Dollar General
Dollar General is an established chain of discount stores selling consumer staples for low prices in neighborhood locations. The company sells its own private-branded goods alongside popular products from Clorox, Procter & Gamble, Coca-Cola, Kellogg’s, General Mills, and more. There are more than 18,000 Dollar General stores in 47 U.S. states.
Dollar General reported its full-year results for 2022:
| 2022 | 2021 | Percentage change | |
| Revenues | $ 37,845 million | $ 34,220 million | 10.6 % |
| Income from Operations | $ 3,328 million | $ 3,221 million | 3.32 % |
| Net Income | $ 2,416 million | $ 2,399 million | 0.7 % |
| Earnings per share | $ 10.73 | $ 10.24 | 4.8 % |
- Revenues reported a net increase of 10.6 % in 2022 as compared to the previous year
- Income from Operations reported a net increase of 3.32 % in 2022 as compared to the previous year
- Net Income reported a net increase of 0.7 % in 2022 as compared to the previous year
- Earnings per share reported a net increase of 4.8 % in 2022 as compared to the previous year
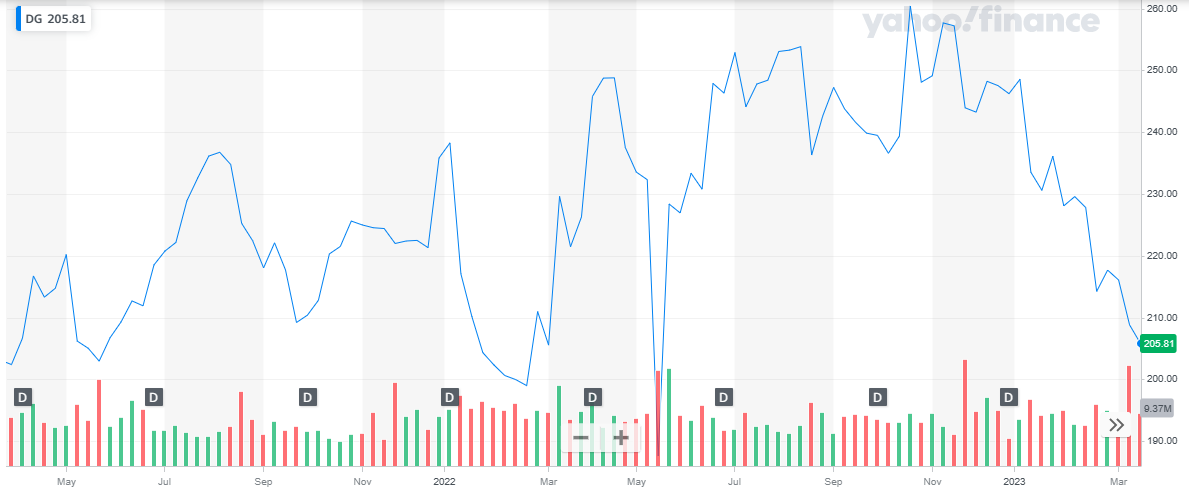
Dollar General has a market cap of $ 46 billion. Its shares are trading at $ 205.81.
The stock started the year 2022 at $ 235.83. throughout the year the stock went through multiple dips and peaks. After an initial drop to $ 198.99, the stock went as high as $ 248.81 and then again dropped to the low of $ 187.6. After that, the stock recovered again went as high as $ 260.44, and closed off the year at $ 246.25. Overall, the stock appreciated by 4 % during the year.
In 2023, the stock went bearish and declined by 16 % to date.
 Read: Top Information Technology Stocks
Eli Lilly
Eli Lilly is a pharmaceutical company that develops important treatments for diabetes, obesity, Alzheimer’s disease, immune system disorders, certain cancers, and Covid-19. The company distributes its products around the world through wholesale distributors and marketing agreements with other pharma companies.
The pharmaceutical giant was founded in Indianapolis in 1876. It introduced the world’s first commercially available insulin product, Iletin, in 1923 for the treatment of diabetes. It was also the first company to manufacture and globally distribute Jonas Salk’s polio vaccine. Today Lilly is known best for clinical depression drugs Prozac (1986) and Cymbalta (2004) and antipsychotic medication Zyprexa (1996), though its biggest revenue drivers are diabetes drugs Trulicity (2014) and Humalog (1996). Still headquartered in Indiana’s capital city, the company made its largest acquisition ever in 2019 when it purchased Stamford, Conn.’s Loxo Oncology for $8 billion.
Eli Lilly reported its full-year results for 2022:
| 2022 | 2021 | Percentage change | |
| Revenues | $ 28,541 million | $ 28,318 million | 1 % |
| Net Income | $ 6,244 million | $ 5,581 million | 12 % |
| Earnings per share | $ 6.9 | $ 6.12 | 13 % |
- Revenues reported a net increase of 1 % in 2022 as compared to the previous year
- Net Income reported a net increase of 12 % in 2022 as compared to the previous year
- Earnings per share reported a net increase of 13 % in 2022 as compared to the previous year
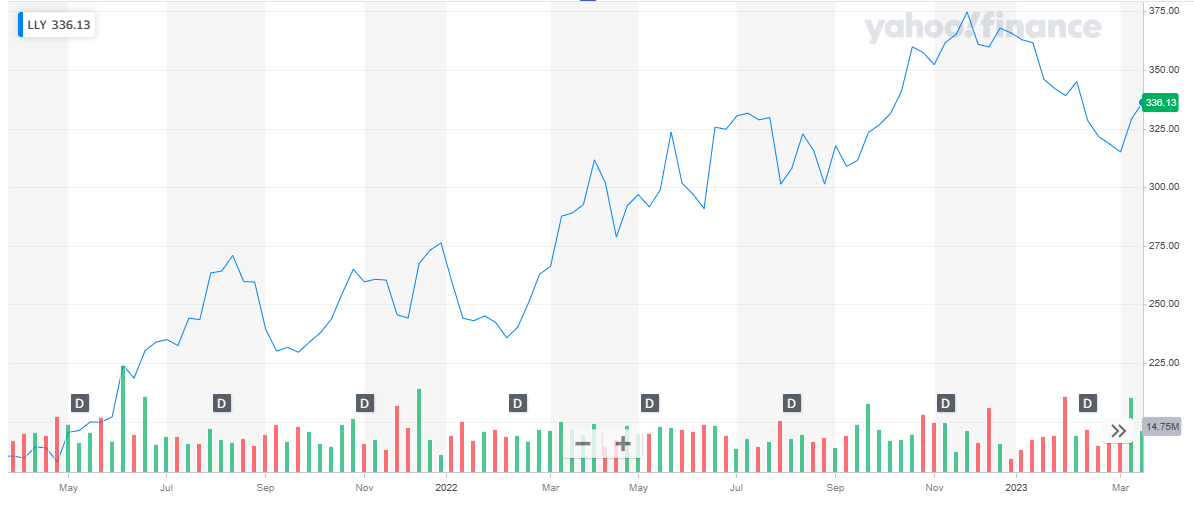
Eli Lilly has a market cap of $ 320 billion. Its shares are trading at $ 336.13.
The stock started in the year 2022 at $ 276.22. The stock picked up a bullish pattern and closed the year at $ 365.84. Overall, the stock appreciated by 32.5 % during the year.
In 2023, the stock reversed its course of action and has depreciated by 8.12 % to date.
 Checkout:
- Best drone stocks
- Forex Signals providers
- Best NFT stocks
- Best swing trading stocks
- Technical analysis books
Pinterest, Inc. operates as a visual discovery engine in the United States and internationally. The company’s engine allows people to find ideas, such as recipes, home and style inspiration, and others; provides video, product, and idea pins; and offers organizing and planning tools. It shows organic recommendations and an advertising engine based on the pinner’s tastes and preferences; and enables pinners with shoppable product pins, which include price, color, and size that redirect to retailer websites.
Pinterest reported its full-year results for 2022:
| 2022 | 2021 | Percentage change | |
| Revenues | $ 2,803 million | $ 2,578 million | 8.72 % |
| Income from operations | ($ 101,677) million | $ 326,187 | – |
| Net Income/ loss | ($ 96) million | $ 316 million | – |
| Earnings per share | ($ 0.14) | $ 0.49 | – |
- Revenues reported a net increase of 8.72 % in 2022 as compared to the previous year
- The company reported a loss from operation as compared to a positive income from operation in the previous year
- Net loss was reported for the year as compared to net profit for the previous year
- Earnings per share were also negative as compared to positive earnings per share for the previous year
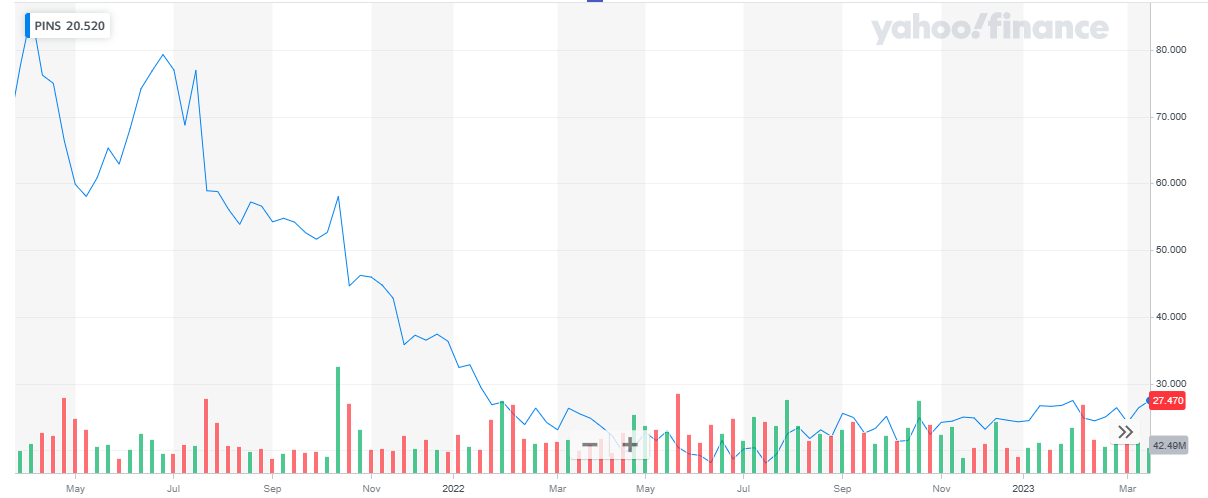
Pinterest has a market cap of $ 18.8 billion. Its shares are trading at $ 27.47.
The stock started the year 2022 at $ 36.35. Throughout the year the stock went bearish and closed the year at $ 24.28. Overall, the stock declined by 33.2 % during the year.
In 2023, the stock remained stagnant initially then picked up the pace. The stock last closed at 27.47 representing a 13.2% appreciation to date.
 ETSY Inc.
Etsy, Inc., together with its subsidiaries, operates two-sided online marketplaces that connect buyers and sellers in the United States, the United Kingdom, Germany, Canada, Australia, France, and India. Its primary marketplace is Etsy.com which connects artisans and entrepreneurs with various consumers. The company also offers Reverb, a musical instrument marketplace; Depop, a fashion resale marketplace; and Elo7, a Brazil-based marketplace for handmade and unique items. In addition, it offers various seller services, including Etsy Payments, a payment processing service; Etsy Ads, an advertising platform; and Shipping Labels, which allows sellers in the United States, Canada, the United Kingdom, Australia, and India to purchase discounted shipping labels. Further, the company provides various seller tools, including a Shop Manager dashboard, a centralized hub for Etsy sellers includes the ability to manage inventory, check order status, receive notifications about repeat customers, add photos, list videos, and purchase and print shipping labels. Additionally, it offers educational resources comprising blog posts, video tutorials, Etsy Seller Handbook, Etsy.com online forums, and insights; Etsy Teams, a platform to build personal relationships with other Etsy sellers; and a Star Seller program. As of December 31, 2022, it connected a total of 7.5 million active sellers to 95.1 million active buyers.
ETSY reported its full-year results for 2022:
| 2022 | 2021 | Percentage change | |
| Revenues | $ 2,566 million | $ 2,329 million | 10.2 % |
| Income from operations | ($ 658) million | $ 465 million | – |
| Net Income/ loss | ($ 694) million | $ 493.5 million | – |
| Earnings per share | ($ 5.48) | $ 3.88 | – |
- Revenues reported a net increase of 10.2 % in 2022 as compared to the previous year
- The company reported a loss from operation as compared to a positive income from operation in the previous year
- Net loss was reported for the year as compared to net profit for the previous year
- Earnings per share were also negative as compared to positive earnings per share for the previous year
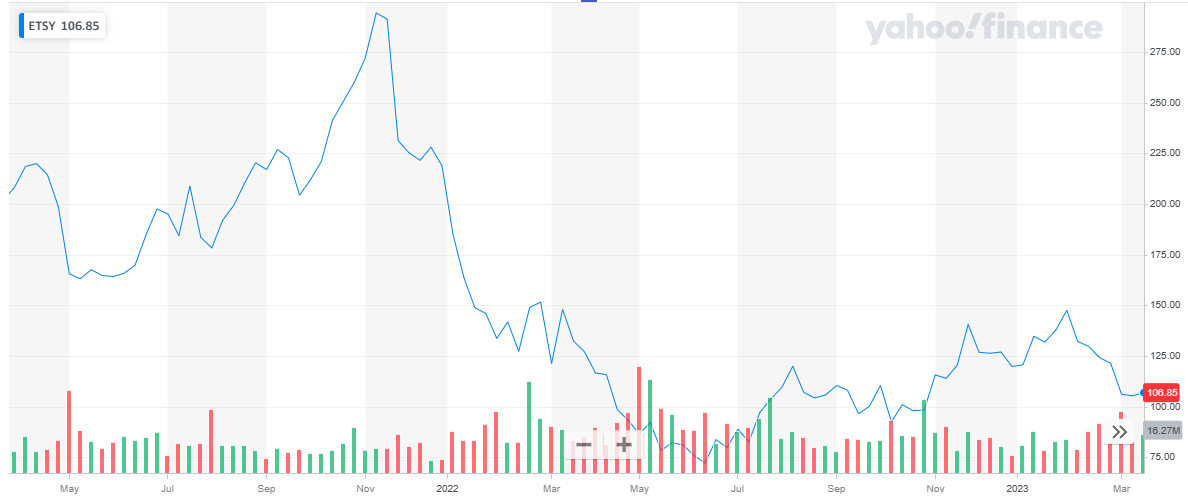
ETSY Inc has a market cap of $ 13.7 billion. Its shares are trading at $ 106.85.
The stock started the year 2022 at $ 218.94. The stock started with a bearish run and went as low as $ 72.11. after that, the stock recovered and closed the year at $ 119.78. Overall, the stock depreciated by 45 %.
In 2023, after an initial rise in price, the stock closed at $ 106.85 representing an 11 % decline to date.
 Checkout:
- Best crypto signals
- Best undervalued stocks
- Best stock indicators
- Top trading blogs
- Best regional bank stocks
- Best crude oil stocks
Intuitive Surgical
Intuitive Surgical Inc (Intuitive Surgical) provides robotic-assisted minimally invasive surgery (MIS) devices. Its portfolio encompasses da Vinci Surgical Systems, InSite and Firefly Fluorescence imaging systems (Firefly), Ion endoluminal systems, instruments, accessories, and training technologies. The company’s systems and instruments find application in multiple surgical specialties, including urological, thoracic, gynecological, cardiac, colorectal, pediatric, and general surgery. It markets products through direct sales organizations and distributors in North America, South America, Europe, Asia-Pacific, the Middle East, and Africa; and operates offices in Europe and Asia-Pacific. Intuitive Surgical is headquartered in Sunnyvale, California, the US.
Intuitive Surgical reported its full-year results for 2022:
| 2022 | 2021 | Percentage change | |
| Revenues | $ 6,222 million | $ 5,710 million | 9 % |
| Income from Operations | $ 1,577 million | $ 1,821 million | -13.4 % |
| Net Income | $ 1,344 million | $ 1,728 million | -22.22 % |
| Earnings per share | $ 3.72 | $ 4.79 | -22.23 % |
- Revenues reported a net increase of 9 % in 2022 as compared to the previous year
- Income from Operations reported a net decrease of 13.4 % in 2022 as compared to the previous year
- Net Income reported a net decrease of 22.22 % in 2022 as compared to the previous year
- Earnings per share reported a net decline of 22.23 % in 2022 as compared to the previous year
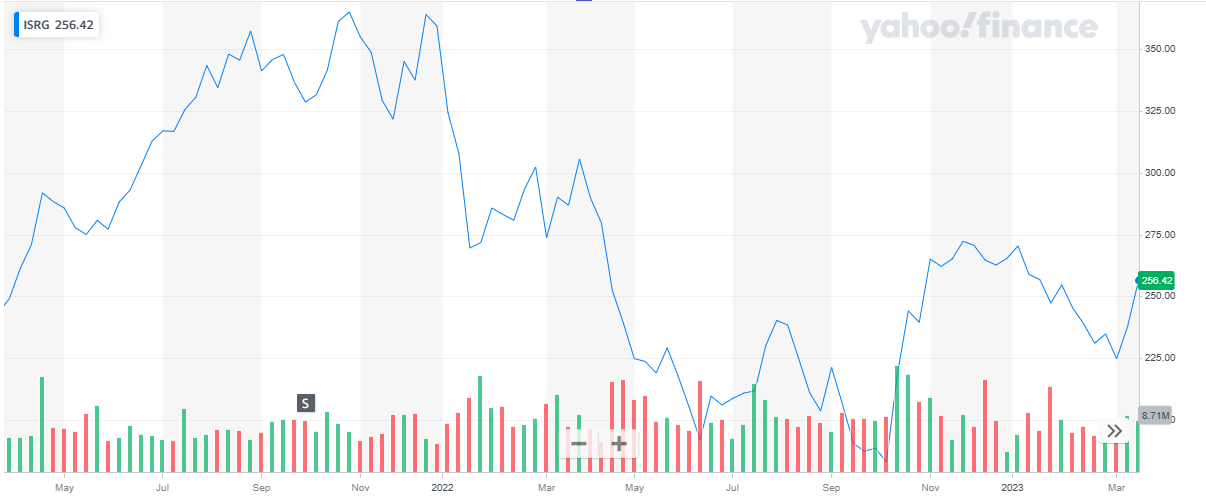
Intuitive Surgical has a market cap of $ 89.8 billion. Its shares are trading at $ 256.42.
The stock of the company started trading at $ 359.3. It started with a declining trend and went as low as $ 183.06 during the year. Eventually, the stock closed at $ 265.35 representing a 26.2 % depreciation during the year.
In 2023, the stock continued to decline and depreciated by 3.4 %.
 Also read:
- Best day trading stocks
- Best stock advisor service
- Best forex indicators
- Best preferred stocks
- Best penny stocks to invest in
- Best crypto day trading strategies
Block
Intuitive Surgical Inc (Intuitive Surgical) provides robotic-assisted minimally invasive surgery (MIS) devices. Its portfolio encompasses da Vinci Surgical Systems, InSite and Firefly Fluorescence imaging systems (Firefly), Ion endoluminal systems, instruments, accessories, and training technologies. The company’s systems and instruments find application in multiple surgical specialties, including urological, thoracic, gynecological, cardiac, colorectal, pediatric, and general surgery. It markets products through direct sales organizations and distributors in North America, South America, Europe, Asia-Pacific, the Middle East, and Africa; and operates offices in Europe and Asia-Pacific. Intuitive Surgical is headquartered in Sunnyvale, California, the US.
Block reported its full-year results for 2022:
| 2022 | 2021 | Percentage change | |
| Revenues | $ 17,531 million | $ 17,661 million | -0.7 % |
| Income from Operations | ($ 624) million | $ 161 million | – |
| Net Income | $ 541 million | $ 166 million | – |
| Earnings per share | ($ 0.93) | $ 0.36 | – |
- Revenues reported a net decline of 0.7 % in 2022 as compared to the previous year
- The company reported a loss from operation as compared to a positive income from operation in the previous year
- Net loss was reported for the year as compared to net profit for the previous year
- Earnings per share were also negative as compared to positive earnings per share for the previous year
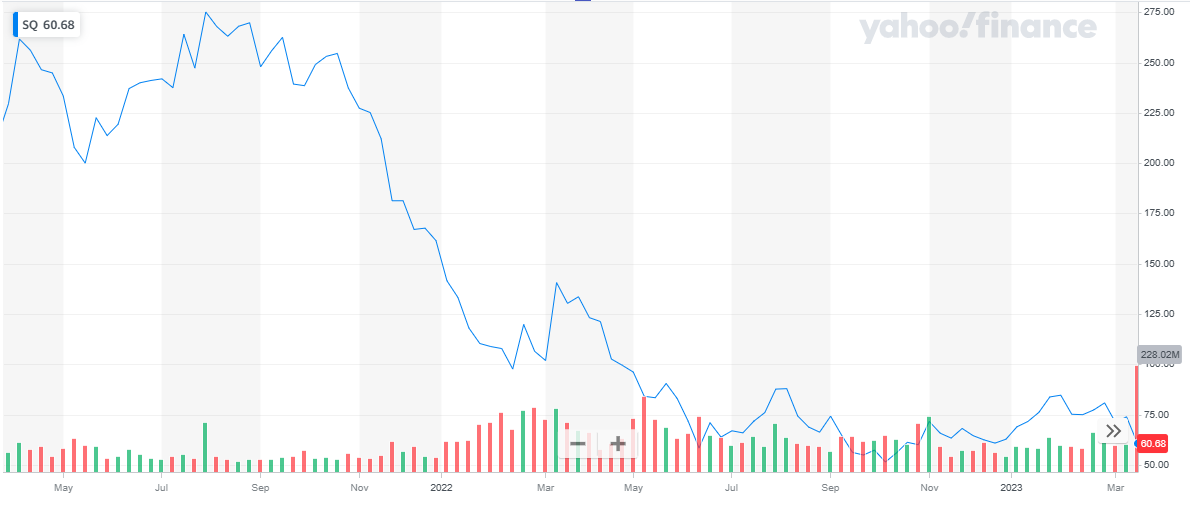
Block has a market cap of $ 37.25 billion. Its shares are trading at $ 60.68.
The stock started the year 2022 at $ 161.51 and picked up a bearish trend. The stock continued to decline throughout the year and closed the year at $ 62.84. Overall, the stock declined by 61 % during the year.
In 2023, the stock remained at the same price level and slightly depreciated by 3.5 %.
Checkout:
- Accurate and Reliable Gold Forecast
- Reliable and Trusted Commodity Signals
Walgreens Boots Alliance
Walgreens Boots Alliance Inc (Walgreens Boots Alliance) is a retail and wholesale company, focused on health and wellbeing products. The company offers pharmacy products, including prescription and non-prescription drugs, beauty and toiletry products, health and wellness services, mail, and central specialty pharmacy services through drugstores and online. It is retail and business brands include Walgreens, Duane Reade, Boots, and Alliance Healthcare. The company’s global health and beauty brands include No7, NICE!, Finest Nutrition, YourGoodSkin, Soap & Glory, Liz Earle, Sleek MakeUP, and Botanics. It operates through its subsidiaries in the Americas and Europe. Walgreens Boots Alliance is headquartered in Deerfield, Illinois, the US.
Walgreens Boots Alliance reported its first quarter results for 2023:
| Q1 2023 | Q1 2022 | Percentage change | |
| Revenues | $ 33,382 million | $ 33,901 million | -1.53 % |
| Income from Operations | ($ 6,151) million | $ 1,283 million | – |
| Net Income | ($ 3,721) million | $ 3,580 million | – |
| Earnings per share | ($ 4.31) | $ 4.13 | – |
- Revenues reported a net decline of 1.53 % in 2022 as compared to the previous year
- The company reported a loss from operation as compared to a positive income from operation in the previous year
- Net loss was reported for the year as compared to net profit for the previous year
- Earnings per share were also negative as compared to positive earnings per share for the previous year
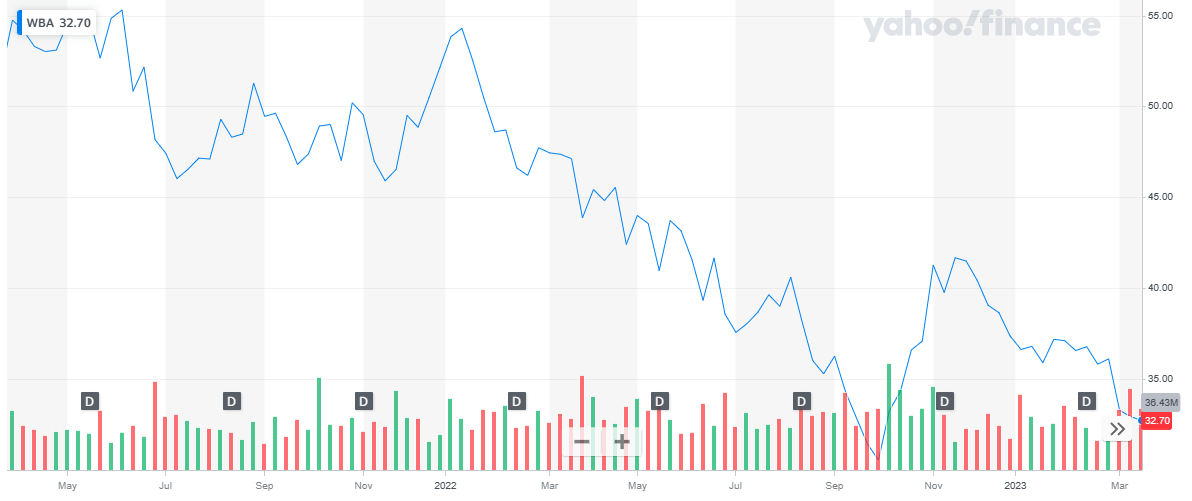
Walgreens Boots Alliance has a market cap of $ 28.2 billion. Its shares are trading at $ 32.7.
The stock started the year 2022 at $ 52.16 and picked up a bearish run. During the year, the stock declined to the low of $ 30.52 and after recovering a bit eventually closed the year at $ 37.36. Overall, the stock depreciated by 28.4 % during the year.
In 2023, the stock continued with its bearish run and has depreciated by 12.5 % to date.
 Read:
Read:
- Forex vs stocks
- Top infrastructure stocks
- Best 3D printing stocks
- Buzzing stocks
- Top trending stocks
- Best AI backed stocks
Aflac Inc.
Aflac Inc (Aflac) is a provider of supplementary insurance. The company along with its subsidiaries offers supplemental health and life insurance products and services to individuals and corporate clients. It offers insurance products for accidents, cancer, critical illness, hospital, short-term disability, and dental. It also offers vision insurance, term insurance, whole life insurance, fixed annuity insurance, child endowment insurance, and hybrid insurance. Its service offerings include claims settlement services, insurance advisory services, enrollment solutions, health reimbursement arrangements, and COBRA administration services. The company distributes its products and services through independent corporate agencies, individual agencies, bancassurance, and affiliated corporate agencies in Japan, and sales associates and brokers in the US. Aflac is headquartered in Columbus, Georgia, the US.
Aflac reported its annual results for 2023:
| 2023 | Q1 2022 | Percentage change | |
| Revenues | $ 19,502 million | $ 22,106 million | -11.8 % |
| Income from Operations | $ 4,604 million | $ 5,322 million | -13.5 % |
| Net Income | $ 4,201 million | $ 4,325 million | -2.9 % |
| Earnings per share | $ 6.62 | $ 6.42 | 3.11 % |
- Revenues reported a net decline of 11.8 % in 2022 as compared to the previous year
- Income from Operations reported a net decrease of 13.5 % in 2022 as compared to the previous year
- Net Income reported a net decrease of 2.9 % in 2022 as compared to the previous year
- Earnings per share reported a net increase of 3.11 % in 2022 as compared to the previous year
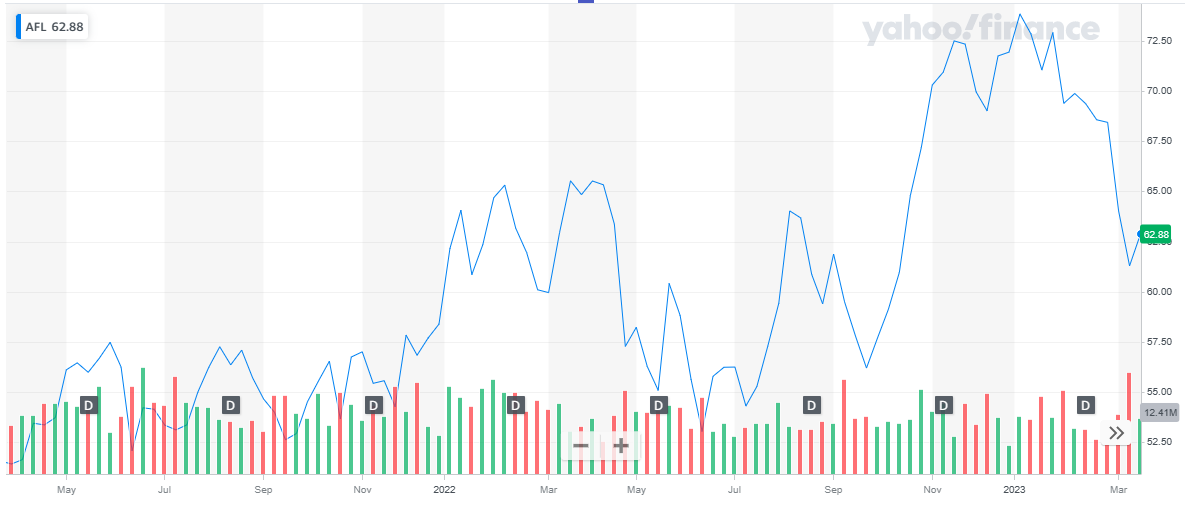
Aflac has a market cap of $ 38.5 billion. Its shares are trading at $ 62.88.
The stock started the year 2022 at $ 58.39. Throughout the year the stock went through multiple dips and peaks. During the last quarter, the stock spiked high and closed off the year at $ 71.94. Overall, the stock appreciated by 23.2 % during the year.
In 2023, the stock reversed its course of action and started to decline. To date, the stock has declined by 12.6 %.
 Intel Corporation
Intel Corp (Intel) designs and develops technology products and components. The company’s product portfolio comprises microprocessors, chipsets, embedded processors and microcontrollers, flash memory, graphic, network and communication, and conferencing. It also offers processors, chipsets, motherboards, solid-state drives, server products, wireless connectivity products, and software and applications. Intel sells its products and solutions to original equipment manufacturers, industrial and communications equipment manufacturers, and original design manufacturers. The company’s products find applications in notebooks, tablets, servers, and desktops. Intel markets processors under Core, Quark, Atom, Celeron, Pentium, Xeon, and Itanium brand names. The company has business operations in China, Singapore, the US, and Taiwan. Intel is headquartered in Santa Clara, California, the US.
Intel Corp. reported its annual results for 2023:
| 2022 | 2021 | Percentage change | |
| Revenues | $ 63,054 million | $ 79,024 million | -20 % |
| Income from Operations | $ 2,334 million | $ 19,456 million | -88 % |
| Net Income | $ 8,014 million | $ 19,868 million | -60 % |
| Earnings per share | $ 1.95 | $ 4.89 | -60 % |
- Revenues reported a net decline of 20 % in 2022 as compared to the previous year
- Income from Operations reported a net decrease of 88 % in 2022 as compared to the previous year
- Net Income reported a net decrease of 60 % in 2022 as compared to the previous year
- Earnings per share reported a net decline of 60 % in 2022 as compared to the previous year
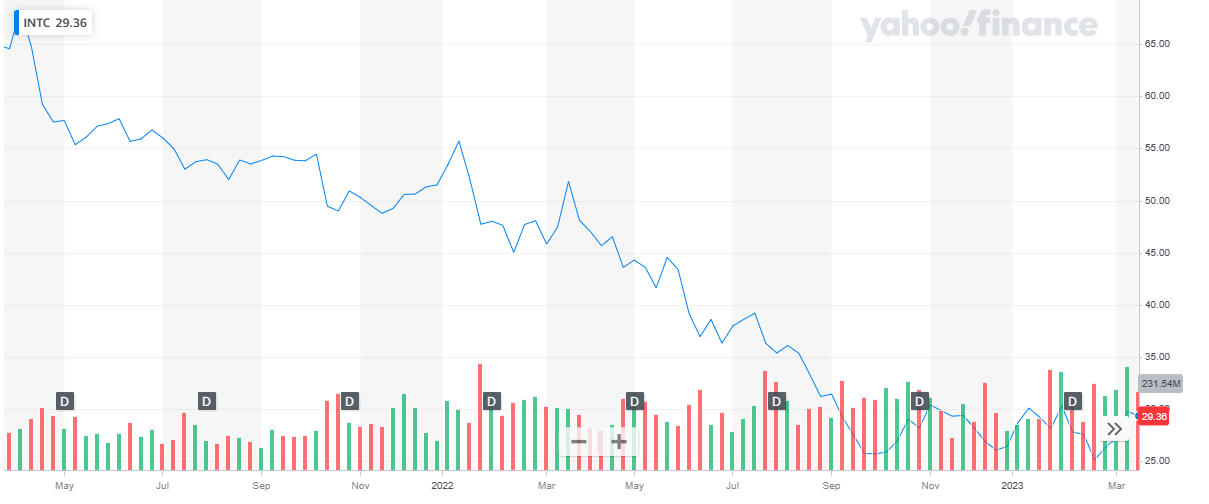
Intel Corp has a market cap of $ 121.5 billion. Its shares are trading at $ 29.36.
The stock started the year 2022 at $ 51.5. Throughout the year the stock went bearish and closed off the year at $ 26.43. Overall, the stock declined by 48.7 %.
In 2023, the stock after an initial rise followed by a price dip, the stock has appreciated by 10 % to date.
 Also read:
