

Silver is currently correcting the bullish cycle that began at the July 2026 low, potentially resulting in a significant pullback. This raises critical questions for traders: what happens once the correction concludes? Will the metal rally toward the January 2026 high, or is it poised for extended sideways movement or further downside?
Following the record highs in late January 2026, Silver experienced a sharp decline, signaling the onset of a significant bearish cycle. Despite this sell-off, many market participants maintain a bullish outlook, anticipating that the metal will eventually break to new highs in the coming weeks, months, or years. Meanwhile, after completing a 7-swing structure in July 2026, Silver received a major boost as dollar weakness encouraged investors to move into riskier assets.
Following the July 2026 lows, Silver rallied, recovering exactly 23.6% of the decline from the January peak while hitting a three-month high in late August. Furthermore, the commodity completed a clear 5-wave structure. Given the shallow depth of this bounce, market participants are anticipating at least another 5-wave move to the upside from the late August pullback extreme. Our global team of Elliotticians at Elliottwave-Forecast suggests that the bearish cycle initiated by the January high is now complete as a supercycle degree wave (II), signaling the start of a broader recovery. This outlook is further supported by a bearish dollar forecast and anticipated acceleration in both equities and high-beta assets.
Silver Elliott Wave Forecast – 5th September 2026
Since the July 2026 low, Silver has completed a 5-wave impulse structure, which we identified as wave ((1)). According to standard Elliott Wave theory, a 5-wave advance is typically followed by a 3-wave pullback before the bullish cycle resumes. We shared the corresponding H4 chart with our members on September 5, 2026, to illustrate this expected development.
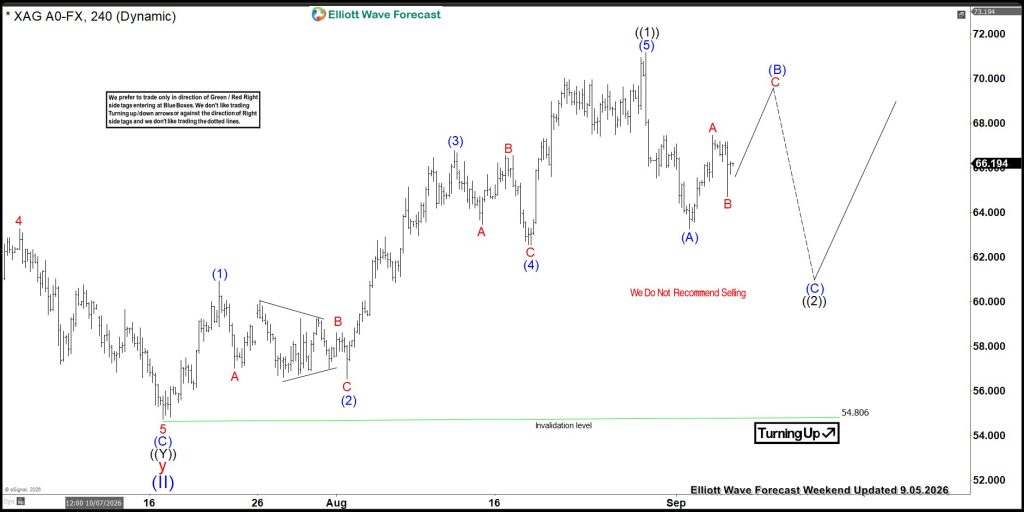
Wave ((2)) began developing from the peak of wave ((1)). Following the completion of a 5-wave structure for wave (A), we anticipated a 3-wave bounce for wave (B), followed by a 5-wave decline in wave (C) to finalize wave ((2)) before the broader bullish cycle from late July could resume. As the chart illustrates wave C of (B) in progress, we projected one final leg higher followed by a swift sell-off.
Silver Elliott Wave Forecast – 10th September 2026
The price has completed wave (B) exactly as anticipated, followed by the expected sell-off for wave (C) of ((2)). Silver is now positioned to extend its decline toward the 60.4–56.4 support zone, where we expect wave ((2)) to conclude before the resumption of the broader bullish trend.
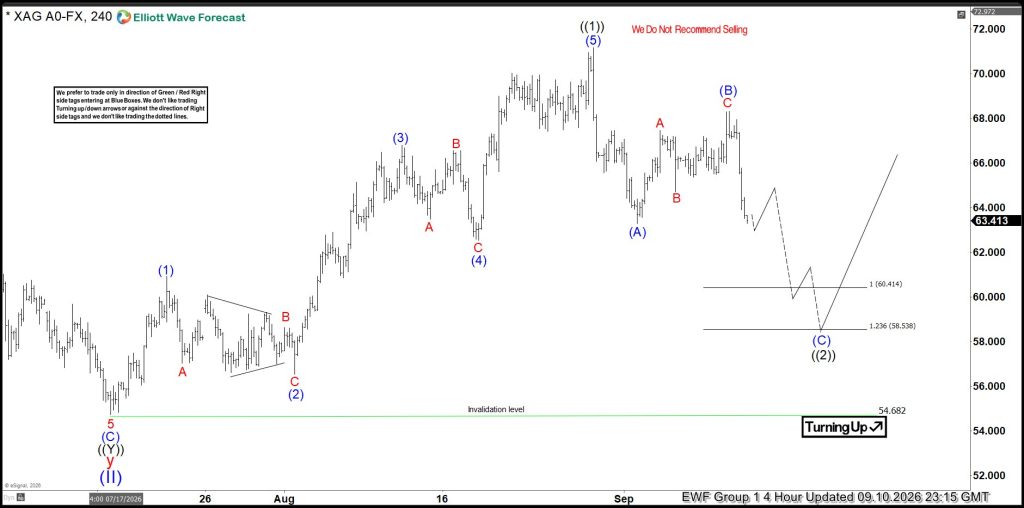
The H4 chart shared on September 6th successfully guided members through the price action seen on September 9th and 10th. This helped them avoid being trapped in premature long positions. With the structure confirming that a significant move was not yet imminent, the question remains: what comes next? We have been tracking these developments closely through our hourly charts, which are updated four times per day for our members. Below is the latest update.
Silver Elliott Wave Forecast – 14th September 2026
The latest H1 chart below highlights the sub-waves of wave (C). The price is currently developing within wave 3 of (C), specifically tracking wave ((ii)) of 3 of (C). We will provide a further update early in the Asian session once new market data becomes available.
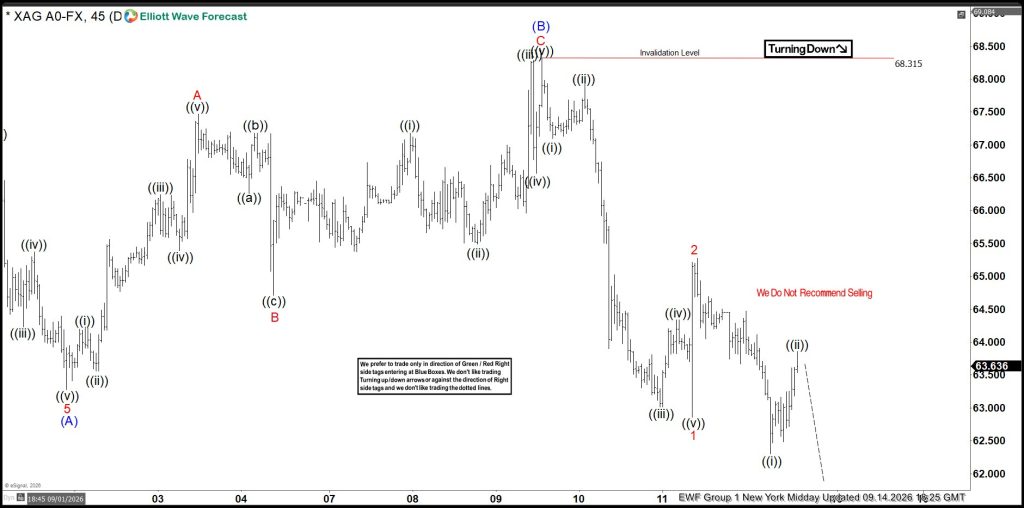
The upcoming Asia H1 update will determine if Silver moves higher to extend wave 2 or breaks below the wave ((i)) low, which would confirm our current count. Additionally, members can access our daily technical video, which outlines the expected price path heading into the London session. This is part of our 24-hour market analysis service. We provide up-to-date technical insights for Silver and over 77 other instruments, including Forex, Cryptocurrencies, ETFs, Stock Indices, and Commodities.
About Elliott Wave Forecast
At www.elliottwave-forecast.com, we update one-hour charts four times daily and four-hour charts once daily for all 78 instruments. We also conduct daily live sessions to guide clients on the right side of the market. Additionally, we have a chat room where moderators answer market-related questions. Experience our service with a 14-day trial for only $0.99. Cancel anytime.


