

Gold has been one of the clearest examples of why structure should come before headlines. The advance from the 2022 low has developed impulsively, producing the characteristics expected from a five-wave Elliott Wave sequence. After the powerful wave (III) advance, Gold has entered the corrective wave (IV) phase shown on our weekly chart.
The important point is what comes after wave (IV).
If the correction has established the foundation for the next impulsive sequence, Gold should eventually resume higher in wave (V). Using the inverse 1.236–1.618 Fibonacci extension of wave (IV), our next major upside target comes in at approximately:
$5,992–$6,627
This is not an arbitrary price objective. It is derived from the relationship between Elliott Wave structure and Fibonacci mathematics. The combination of the developing five-wave sequence, the completed or maturing wave (IV) correction, and the broader structural backdrop continues to favor the upside.
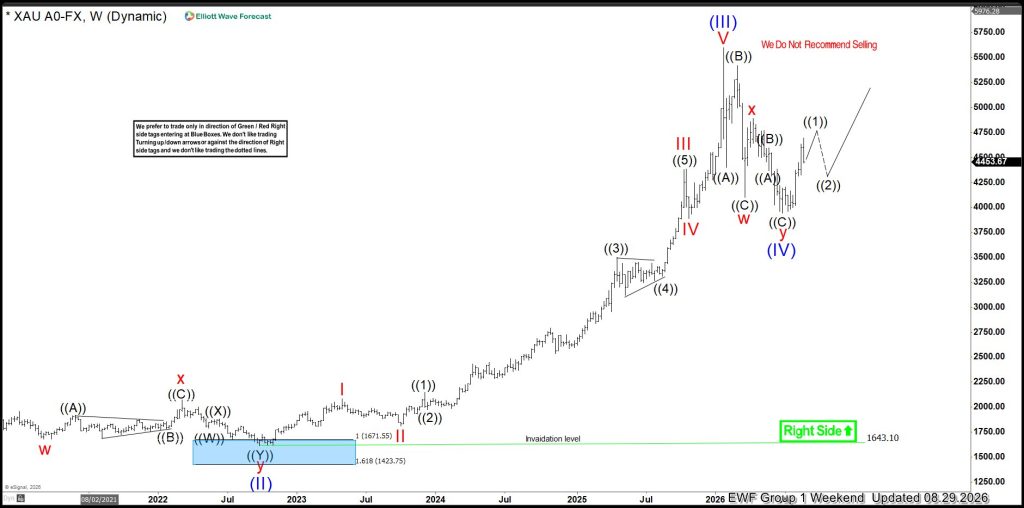
Gold’s Long-Term Structure: Wave (II) Created the Foundation
The long-term Gold structure became particularly important following the 2022 low.
Our weekly chart identifies that area as the completion of a major wave (II) correction. The chart also shows the key invalidation level at approximately $1,643.10.
From that wave (II) low, Gold began a powerful impulsive advance.
The progression is important because Elliott Wave theory states that a directional impulse normally unfolds in five waves:
Wave 1 → Wave 2 → Wave 3 → Wave 4 → Wave 5
Waves 1, 3 and 5 move in the direction of the dominant trend, while waves 2 and 4 are corrective phases against that trend.
Gold has already demonstrated the most powerful portion of this sequence through wave (III). The market then entered the larger wave (IV) correction.
That means the structural expectation is not necessarily that Gold’s advance is finished.
Rather, the Elliott Wave sequence argues that another wave higher—wave (V)—should still be capable of developing.
Why Five Waves Matter
The five-wave impulse is one of the most important structures in Elliott Wave analysis.
A bullish impulse normally develops as follows:
Wave 1: The first advance begins while sentiment is often still skeptical.
Wave 2: The market corrects but remains above the origin of wave 1.
Wave 3: The strongest and normally most recognizable portion of the advance develops.
Wave 4: The market corrects again, often creating the impression that the trend may be finished.
Wave 5: The final leg of the impulse pushes the market to another extreme.
Gold’s long-term structure fits this framework particularly well.
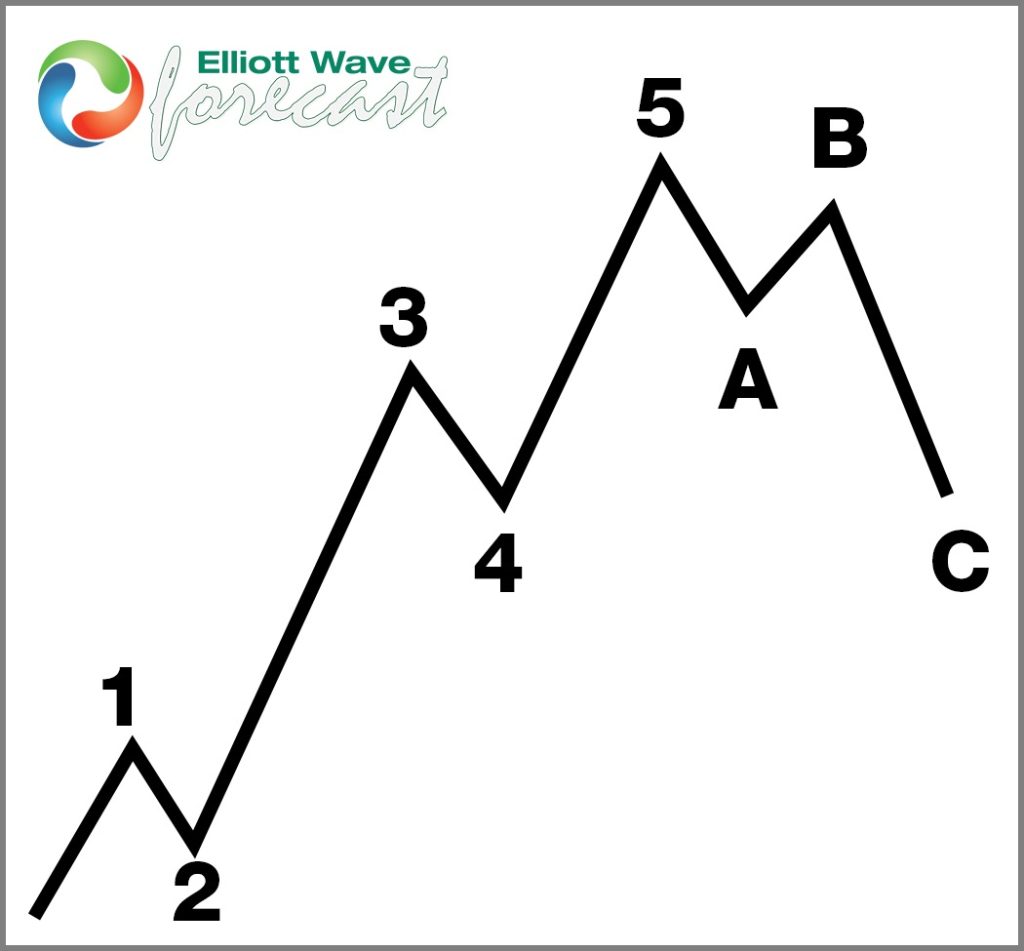
The wave (III) advance was powerful and extended. That is consistent with the behavior normally expected from a third wave.
The subsequent wave (IV) correction is therefore not automatically bearish.
Within an Elliott Wave impulse, wave 4 is a necessary corrective phase separating wave 3 from wave 5.
This distinction matters.
A correction within a bullish impulse is very different from the beginning of a new long-term bearish trend.
Our weekly Gold chart continues to favor the interpretation that the decline from wave (III) belongs to wave (IV), and that the larger bullish sequence remains incomplete.
Understanding Gold’s Wave (IV)
The correction from the wave (III) peak developed through a complex corrective structure.
On the chart, we can see combinations of corrective labels including W-X-Y and A-B-C subdivisions. This is common during fourth-wave corrections because wave 4 frequently consumes time through sideways or complex price action rather than producing a simple straight-line decline.
The market does not need to move vertically higher immediately.
What matters is whether Gold can complete the corrective sequence while preserving the larger impulsive structure.
The chart now shows the possibility that wave (IV) has either completed or is sufficiently mature for Gold to begin building the next bullish sequence.
The smaller-degree projection is also important.
Gold can initially advance in ((1)), correct in ((2)), and then begin accelerating higher.
That would create the internal subdivisions necessary for the development of the larger wave (V).
The important message is straightforward:
Wave (III) delivered the major acceleration. Wave (IV) provided the correction. Wave (V) remains the next structural objective.
Why the Next Target Is $5,992–$6,627
This is where Fibonacci mathematics becomes particularly useful.
Elliott Wave analysis does not simply identify wave labels. Fibonacci relationships allow us to estimate where subsequent waves can terminate.
For Gold, the next major target comes from applying the inverse 1.236–1.618 extension of wave (IV).
That produces the projected zone at:
1.236 inverse extension: approximately $5,992
1.618 inverse extension: approximately $6,627
Therefore, the principal wave (V) target becomes:
$5,992–$6,627
We view this as a target zone, not as a single exact price that Gold must touch.
Financial markets operate through ranges, and Fibonacci relationships are most useful when several structural factors converge within the same area.
What Does an “Inverse Fibonacci Extension” Mean?
To understand the projection, it helps to separate retracements from extensions.
Suppose wave (III) finishes at a high and wave (IV) then declines.
That wave (IV) decline creates a measurable price range.
Instead of using that measurement to look for another downside objective, we can invert the correction and project its magnitude upward from the wave (IV) low.
Conceptually, if:
H = beginning of the wave (IV) correction
L = completion of wave (IV)
then the magnitude of wave (IV) is:
Wave (IV) size = H − L
The inverse extension projects that corrective range back in the direction of the dominant bullish trend:
Target = L + Fibonacci Ratio × Wave (IV) size
Using Fibonacci multipliers such as 1.236 and 1.618, the correction becomes the measuring unit for the next advance.
Applied to Gold’s wave (IV) structure, those relationships produce the broader $5,992–$6,627 objective.
That is why this target is structurally derived rather than simply selected because it represents a psychologically attractive round number.
Why Fibonacci Ratios Appear in Elliott Wave Analysis
Fibonacci relationships are deeply integrated into Elliott Wave methodology because impulsive and corrective waves frequently demonstrate proportional relationships to one another.
The Fibonacci sequence begins:
1, 1, 2, 3, 5, 8, 13, 21, 34, 55, 89, 144…
Each number is approximately the sum of the previous two.
As the sequence progresses, dividing one Fibonacci number by the previous number increasingly approaches:
1.618
This is commonly called the Golden Ratio or φ.
Its reciprocal is approximately:
0.618
Additional ratios can then be derived from those relationships:
0.382
0.618
1.000
1.236
1.618
2.618
These ratios frequently appear when measuring retracements and extensions between Elliott Waves.
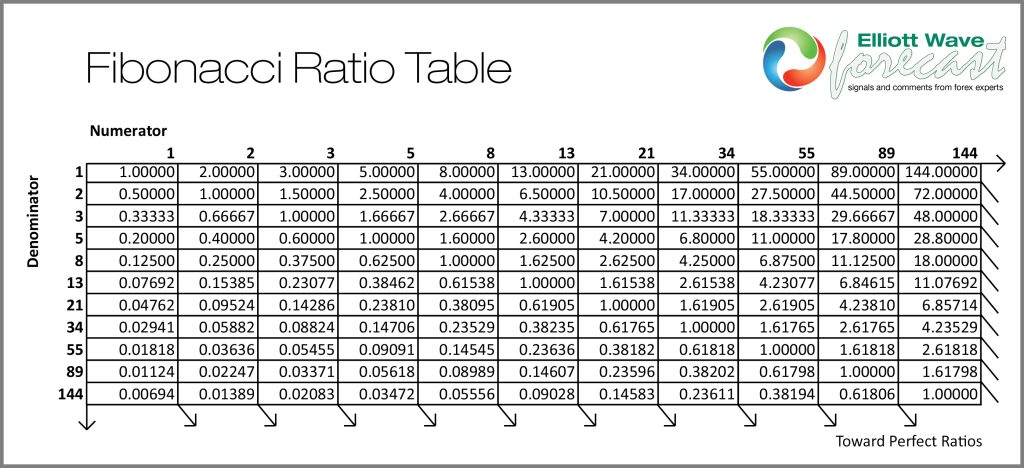
The table illustrates an important mathematical characteristic of the Fibonacci sequence: as the numbers become larger, the ratios between them converge increasingly toward stable Fibonacci relationships.
This is why Elliott Wave analysis does not treat Fibonacci levels as isolated numbers.
They are used to compare the proportional relationship between different waves of the same market structure.
Why 1.236 and 1.618 Are Important Here
The 1.618 extension is especially important because it represents the Golden Ratio and appears frequently during impulsive market expansions.
The 1.236 extension provides another important proportional projection. It can be viewed as a derived Fibonacci relationship and is frequently useful when markets extend beyond a prior extreme without necessarily reaching a full 1.618 expansion immediately.
Together, the 1.236–1.618 area creates a Fibonacci extension zone rather than forcing the forecast to depend on one exact number.
For Gold, that is particularly useful.
Wave (V) does not have to equal one precise mathematical relationship.
Instead, the market can enter the projected Fibonacci area and begin showing evidence that the larger five-wave sequence is becoming mature.
That is why we prefer the range:
$5,992–$6,627
rather than claiming that one individual price must represent the final high.
The Internal Structure of Wave (V) Will Matter
One important point should not be overlooked.
Wave (V) itself should subdivide.
A larger fifth wave normally develops internally as another sequence of waves:
((1)) → ((2)) → ((3)) → ((4)) → ((5))
The weekly Gold chart already illustrates the possibility of the first stages of that process.
An initial rally can complete wave ((1)).
A subsequent pullback can develop as wave ((2)).
If the market then accelerates in wave ((3)), the larger wave (V) advance would become increasingly visible.
This is why short-term corrections do not necessarily contradict the long-term bullish forecast.
They may be required to build the internal structure.
The stronger confirmation would come if Gold continues producing bullish impulses followed by corrective pullbacks that hold above important structural lows.
That would create the necessary building blocks for the larger advance toward the Fibonacci extension zone.
Fundamentals Can Support the Gold Structure
Our methodology places structure first, but fundamentals can provide the environment that eventually supports the Elliott Wave path.
Several long-term themes can continue to provide a constructive backdrop for Gold.
Central-Bank Demand and Reserve Diversification
Gold remains one of the world’s primary monetary reserve assets.
Countries seeking greater diversification of foreign-exchange reserves can increase strategic demand for physical Gold.
That process does not need to occur quickly to affect the long-term cycle. Persistent institutional accumulation can provide an important structural source of demand.
Fiscal Deficits and Sovereign Debt
Large fiscal deficits and expanding sovereign debt can also increase demand for assets that are viewed as stores of value outside the traditional fiat monetary system.
The significance is not that debt automatically causes Gold to rise every year.
Rather, persistent concerns about fiscal sustainability can contribute to a longer-term monetary premium for Gold.
Real Interest Rates
Gold has historically been sensitive to real interest-rate expectations.
When investors anticipate declining real yields or easier monetary conditions, the opportunity cost associated with holding a non-yielding asset such as Gold can fall.
A future environment of monetary easing or falling real rates could therefore provide a fundamental catalyst for the next impulsive advance.
Currency Diversification
Gold also functions as an alternative monetary asset.
Periods of concern regarding purchasing power, currency debasement or excessive monetary expansion can increase interest in Gold.
This becomes particularly important when the structural chart is already pointing higher.
Geopolitical Risk
Gold continues to function as a strategic hedge during periods of geopolitical uncertainty.
No single geopolitical event is required to produce the Elliott Wave target, but persistent global instability can reinforce long-term institutional demand.
Constrained Supply
Gold mine production cannot be increased instantly in response to price.
New discoveries, permitting, development and mine construction require significant capital and considerable time.
That supply constraint can become increasingly important if investment and central-bank demand expand simultaneously.
Gold and Copper: Different Fundamentals, Similar Structural Message
There is another interesting element to the bullish Gold outlook.
We have also been following an important Elliott Wave development in Copper ($HG).
Gold and Copper are fundamentally different markets.
Gold is heavily influenced by monetary conditions, reserve demand, real yields and safe-haven flows.
Copper is much more sensitive to industrial activity, electrification, infrastructure, power generation, grid investment and economic growth.
Yet Elliott Wave structure can reveal something that traditional fundamental analysis sometimes misses:
different markets can enter powerful impulsive phases at the same time.
Our recent analysis of Copper ($HG) and Dow Jones Futures ($YM) highlighted how overlapping bullish structures can reveal a developing nest and potentially signal a much larger market acceleration:
Dow Jones and Copper: Why the Overlap Reveals a Nest and Signals a Major Risk-On Acceleration
Dow Jones and Copper: Why the Overlap Reveals a Nest and Signals a Major Risk-On Acceleration
The significance for Gold is not that $HG and $XAU must move tick-for-tick together.
They should not.
The larger message is that multiple major asset classes can simultaneously remain inside incomplete bullish Elliott Wave cycles.
Copper can express the industrial and growth side of that cycle.
Dow Jones can express the equity-market side.
Gold can express the monetary and hard-asset side.
When several major markets independently display incomplete bullish structures, it deserves attention.
Copper and Gold Can Rise for Different Reasons
This distinction is particularly important.
Some investors assume Gold and Copper must provide contradictory economic signals.
That does not necessarily need to be the case.
Copper can rise because of:
Electrification
Grid investment
AI-related electricity demand
Infrastructure requirements
Supply constraints
Industrial expansion
Gold can rise simultaneously because of:
Monetary demand
Central-bank accumulation
Currency diversification
Fiscal concerns
Lower real-rate expectations
Geopolitical hedging
Consequently, a strong Copper market does not invalidate a bullish Gold structure.
Both can participate in a broader hard-asset and nominal-price expansion, while their individual fundamental catalysts remain different.
That makes the structure in $HG particularly interesting when viewed alongside Gold.
Structure Comes Before the Explanation
One of the greatest advantages of Elliott Wave analysis is that we do not need to identify the exact fundamental catalyst years before it occurs.
Financial markets frequently begin building their structures before the eventual narrative becomes obvious.
Gold demonstrated this after the 2022 wave (II) low.
At that point, the market structure began signaling the possibility of a much larger bullish cycle.
The subsequent wave (III) advance validated that structural interpretation.
Now the market has moved into another important phase.
Wave (IV) represents the correction.
Wave (V) should represent the next opportunity for expansion.
Eventually, the financial media may attribute that advance to interest rates, central-bank purchases, inflation, currency concerns, geopolitical events or another catalyst.
But from an Elliott Wave perspective, the more important observation comes first:
The five-wave sequence remains incomplete.
Conclusion: Gold’s Next Major Objective Is $5,992–$6,627
Gold’s long-term Elliott Wave structure continues to present a compelling case for additional upside.
The major wave (II) low created the foundation.
Wave (III) delivered the powerful impulsive advance.
Wave (IV) has provided the necessary correction.
And if that structure remains intact, the next major phase should be wave (V).
Using the inverse 1.236–1.618 Fibonacci extension of wave (IV), the next major Gold target comes in at:
$5,992–$6,627
The significance of this range goes beyond the numbers themselves.
It combines three important elements:
A five-wave Elliott Wave advance, a completed or maturing wave (IV) correction, and a Fibonacci projection for the next impulsive phase.
The bullish structures developing elsewhere—including Copper ($HG)—add another dimension to the long-term outlook. They suggest that Gold’s advance may not be occurring in isolation, but as part of a broader structural expansion across several important asset classes.
There will be corrections along the way. Wave (V) itself should contain smaller waves 1, 2, 3, 4 and 5, meaning the path toward the target is unlikely to be a straight line.
But the larger roadmap remains clear.
As long as the Elliott Wave structure continues to validate the bullish sequence, Gold’s next major objective remains the $5,992–$6,627 area.




