

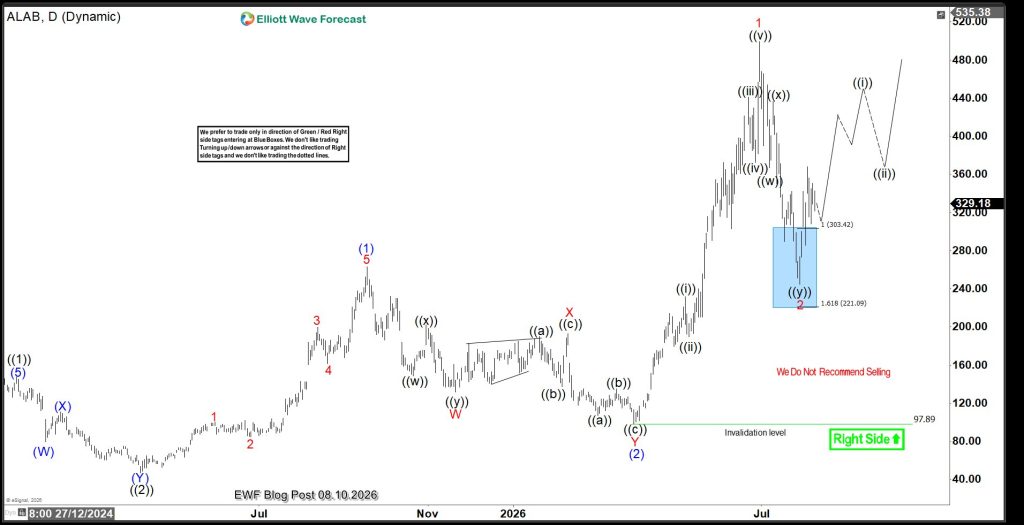
Astera Lab, ALAB, is retreating after over 410% gain between April and June 2026. The retracement has found support in the blue box. is this the start of a new bullish phase?
Astera Labs is a semiconductor company that builds high-speed connectivity chips and software for AI and cloud data centers. Its products help CPUs, GPUs, memory, and networks communicate faster and more efficiently, making large AI systems and data centers perform better. Founded in 2017 and headquartered in San Jose, California, Astera Labs is a key beneficiary of the growing demand for AI infrastructure.
The stock launched its IPO on March 19, 2024, at $36 per share and was listed on the NASDAQ the following day under the ticker ALAB. It immediately traded at $50.60 before surging to $95.20 about a month later. From that peak, however, the stock gradually declined over the next five months, eventually reaching a low of $36.20. From that low, the stock never looked back and began a strong upward move. Therefore, the Elliott Wave forecast discussed in this post begins from the August 2024 low.
ALAB Elliott Wave Analysis – Daily Chart
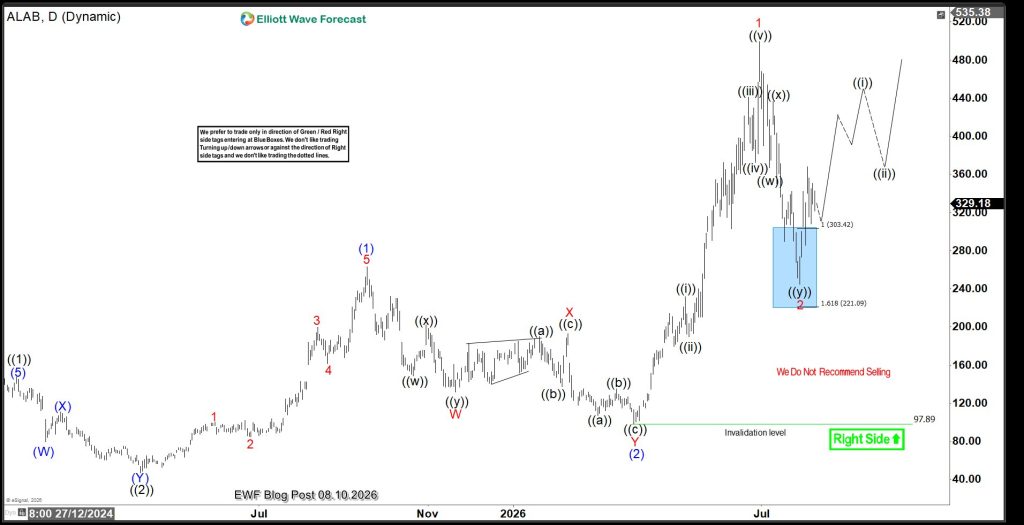
ALAB began its first bullish cycle from the all-time low and rallied to $147 on January 6, 2025, where it completed wave ((1)). Wave ((1)) formed a clear impulse structure.
From the top of wave ((1)), wave ((2)) began and developed into a double zigzag, eventually ending at $47 on April 4, 2025. From this low, the third swing began and completed another impulse wave structure on September 18, 2025, reaching $244 before the fourth swing followed with a double zigzag that ended on March 30, 2026.
However, the fourth swing entered the price territory of the first swing. Therefore, it cannot be considered wave 4 of a larger-degree impulse structure. As a result, we can instead consider a nested structure of ((1))-((2))-(1)-(2), which could lead to a strong impulse sequence at the primary degree.
Wave (2) of ((3)) ended at $97.89. From this low, the stock surged massively to hit $456 which is now its record high. Normally, this was suppose to be wave (3) as we have identified in the previous update. However, the pullback went very deep and reach the territory of wave (1). Thus, it will violate one of the key rules of an impulse wave structure. The rule states that wave 4 does not correct into the territory of wave 1. Thus, we can identify the surge to $456 as wave 1 of 93) and the decline that followed to be wave 2 of (3). Thus, the long term structure is in a multiple nest.
Very interestingly, the wave 2 pullback completed a 7-swing structure at the blue box and bounced. Thus, for as long as it trades above the 29-July low, the upside will be supported in the short ter. From the July low, we’d expect another 5-wave up for ((i)) of 3. The price target for around $740-$893. If wave ((i)) rallies as expected and completed a 5-wave structure, traders can continue to buy the dips from the extreme in subsequent trades.
About Elliott Wave Forecast
At www.elliottwave-forecast.com, we update one-hour charts four times daily and four-hour charts once daily for all 78 instruments. We also conduct daily live sessions to guide clients on the right side of the market. Additionally, we have a chat room where moderators answer market-related questions. Experience our service with a 14-day trial for only $0.99. Cancel anytime.




