

Analysts remain cautious on QS because the company is still pre‑revenue and continues to burn cash. Even so, they highlight recent manufacturing progress and note that partnerships like Honda and Volkswagen keep long‑term potential alive. We see this mixed sentiment creating wide price targets and uneven expectations for the next quarters.
At the same time, analysts warn that commercialization delays remain the biggest risk. However, they also point to strong liquidity and improving pilot‑line performance as positive signs. We expect these themes to dominate analyst commentary over the next three months as QS works to prove it can scale its solid‑state technology.
Elliott Wave Outlook: QuantumScape (QS) Weekly Chart May 2026
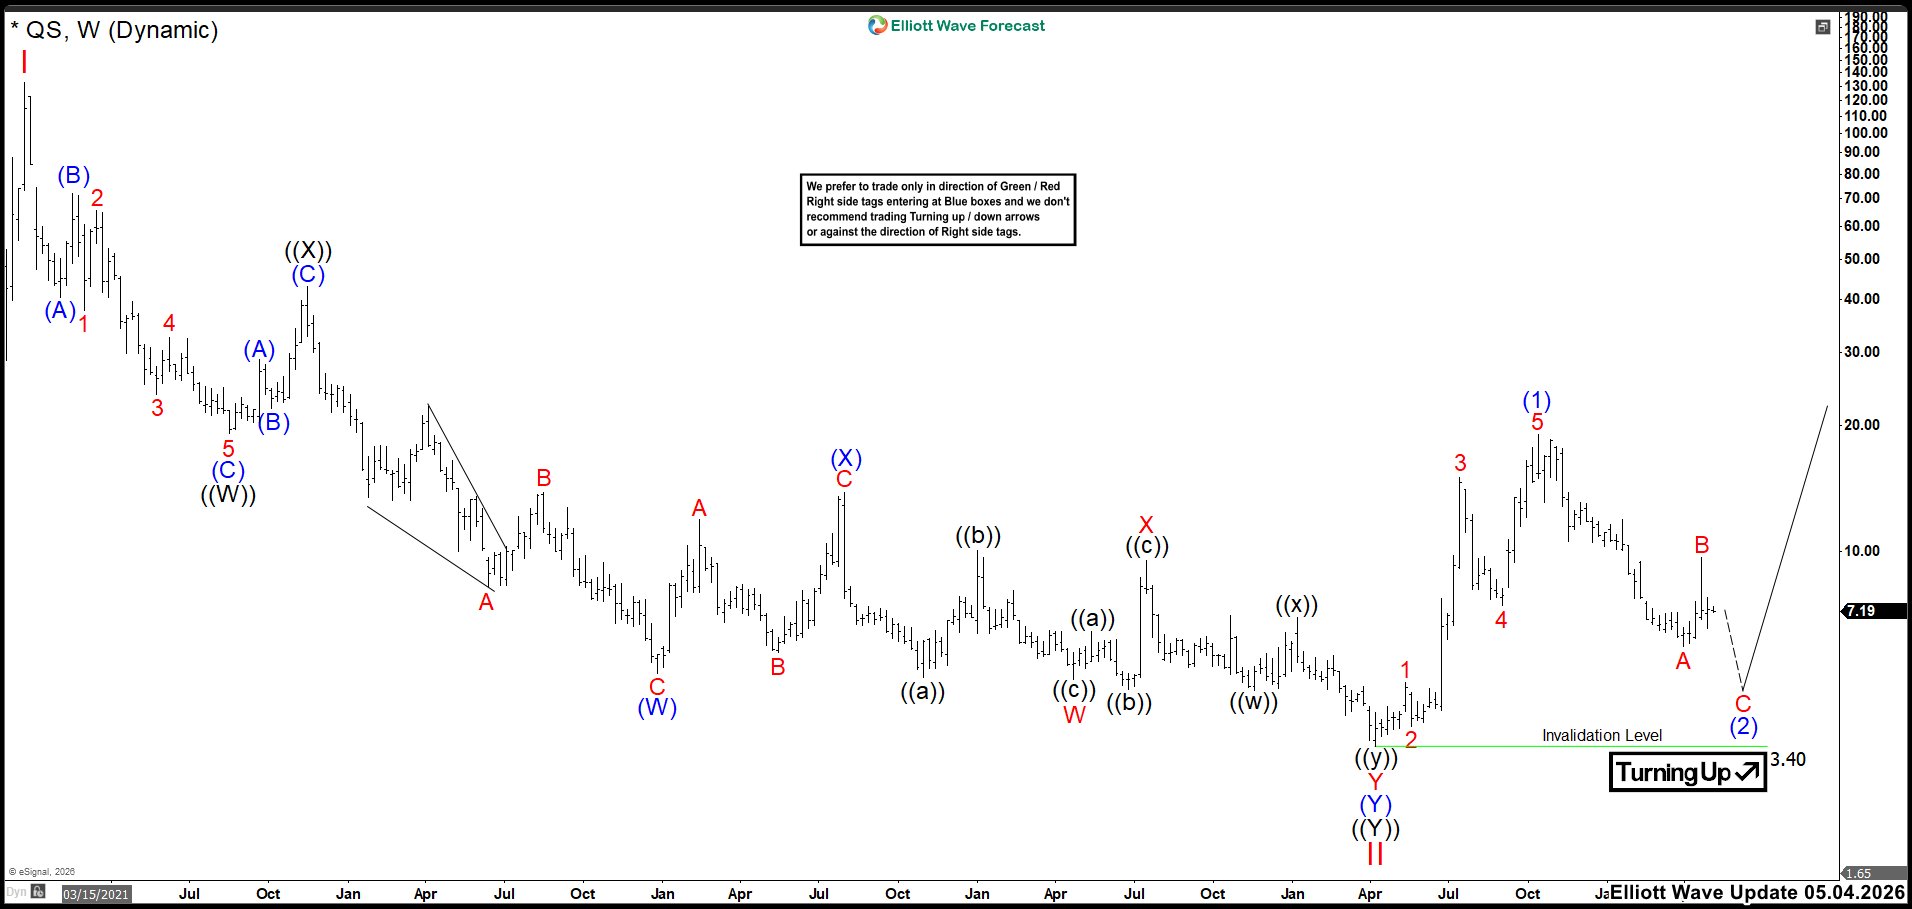
Back in May, wave A fell harder than we expected and hit the 6‑dollar zone. We saw QS bounce to 9.66 and complete Wave B. After that bounce, we still expected more downside to finish three waves and complete the Wave (2) correction. Only then were we ready to look for buying setups to trade Wave (3) of the impulse.
We viewed the ideal area to finish the correction between 5.03 and 3.60. In that region, the market had to show a strong bullish reaction to confirm the pullback had ended and the next upward cycle could continue.
(If you want to learn more about Elliott Wave Principle, please follow these links: and .)
Elliott Wave Principle Behind the Market Structure
Impulse
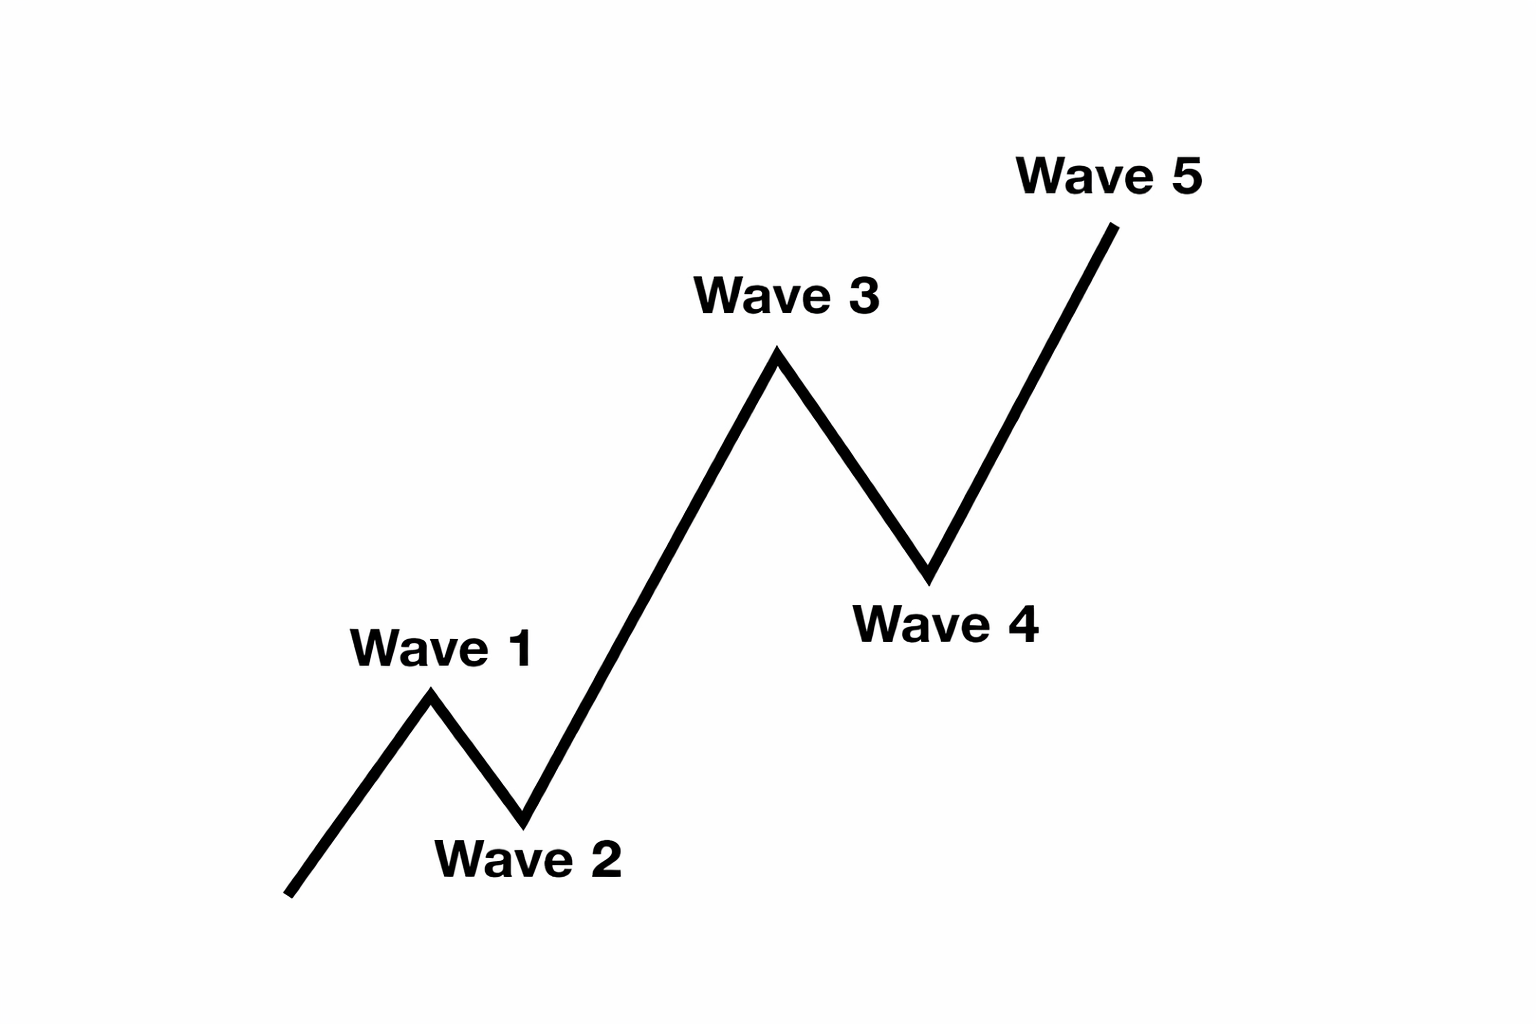
An impulse is a clean 5‑wave pattern that drives the trend forward.
- Waves 1‑3‑5 are strong and directional.
- No overlap between waves 1 and 4.
- Wave 3 is usually the strongest.
- Structure is clear, with increasing momentum.
Elliott Wave Outlook: QuantumScape (QS) Weekly Chart August 2026
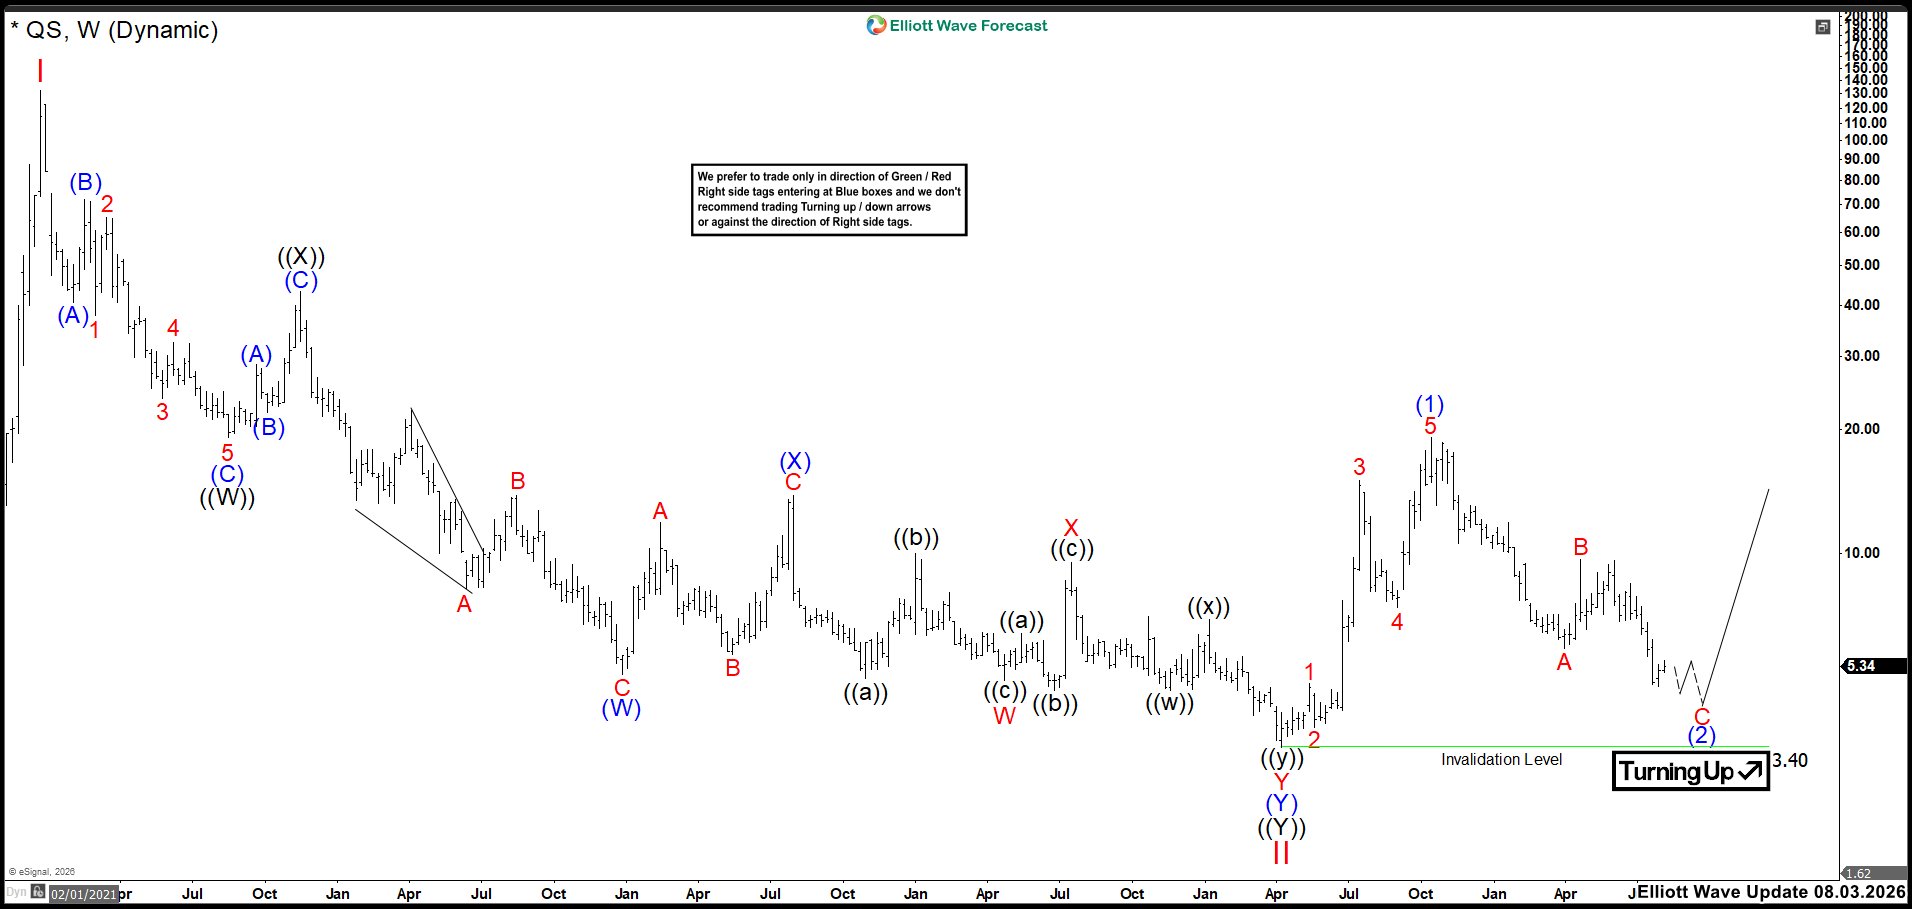
As we see on the chart, Wave B resisted the buyers’ pressure and the market continued lower. Price has already reached the 5.03–3.60 zone, and it could start moving higher from here. Even so, the short‑term bearish structure still looks incomplete, and we expect more downside before the trend can turn.
At this stage, we ideally want to see two additional lows to complete the Wave C impulse and form a clean bottom. In the worst case, the market may produce one final low below 4.77 before confirming a bullish reversal. Once that structure finishes, we will look for signs that the next upward cycle is ready to begin.
Transform Your Trading with Elliott Wave Forecast!
Ready to take control of your trading journey? At Elliott Wave Forecast, we provide the tools you need to stay ahead in the market:
Blue Boxes: Stay ahead in the market with fresh 1-hour charts updated four times daily, daily 4-hour charts on 78 instruments, and precise Blue Box zones that highlight high-probability trade setups based on sequences and cycles.
Live Sessions: Join our daily live discussions and stay on the right side of the market.
Real-Time Guidance: Get your questions answered in our interactive chat room with expert moderators.
🔥 Special Offer: Start your journey with a 14-day trial for only $0.99. Gain access to exclusive forecasts and Blue Box trade setups. No risks, cancel anytime by reaching out to us at support@elliottwave-forecast.com.
💡 Don’t wait and get a DISCOUNT for any plan!
Click in the next link, go to Home Chat and ask for a flat discount code saying that you saw this in Luis’ Blog: 🌐


