What are FAANG Stocks?
FAANG is an acronym that stands for the five largest and most popular stocks. Together they make up a market cap of nearly five trillion dollars (as of July 2022). The FAANG stocks stand for the following companies:
- Meta (Formerly known as Facebook)
- Amazon
- Apple
- Netflix
- Alphabet (Formerly known as Google)
“FANG” was originally coined by the famous Jim Cramer of the CNBC show Mad Money. He coined the term back in 2013 saying that these firms are, totally dominant in their markets.
Originally the term excluded Apple but was amended to include it in 2017. That is when the acronym changed from FANG to FAANG stocks.
Why are FANG Stocks so popular?
The FAANG stocks represent some of the most influential businesses that exist in current times. They have huge businesses and are the leaders in their line of work.
These five companies represent approximately 13 % of the NASDAQ index. Moreover, another interesting fact about these FAANG stocks is that they make up 1 % of the S&P 500 Index. The FAANG stocks have a history of outperforming the market. The growth of these companies is almost legendary. What is more, all the FAANG stocks did well for their separate reasons during the Covid-19 pandemic in 2020.
- Facebook reported roughly 2.96 billion Monthly Active users for the third quarter of 2022
- Amazon reported net sales of $ 127.1 billion for the third quarter of 2022
- Apple reported revenue of $ 83.0 billion and a profit of $19.4 billion in the third quarter of 2022
- Netflix had approximately 223 million paid subscribers worldwide as of the third quarter of 2022
- Google has more than 9 billion searches daily and reported $ 69 billion in revenue for the third quarter of 2022
Pros and Cons of investing in FAANG Stocks
FAANG Stocks are not just popular they are among the largest companies in the world. Moreover, four of the FAANG stocks are included in the top 10 of the S&P 500.
Let us discuss the advantage and disadvantages of investing in these stocks:
Advantages
- Investing in FAANG stocks gives exposure to the leaders of the tech industry
- All these companies are involved in the most innovative technologies in the world
- Investors also get exposure to the streaming media industry, the cloud, and smart homes technology
- All these companies have strong fundamentals owing to their years of experience and dynamic leadership
- All these stocks offer above-market returns. As a result, the overall index is also significantly affected by their performance
Disadvantages
- Tech stocks are at high risk of regulatory scrutiny
- All these companies are now eating away at each other’s market share
- Due to their high valuations, their stock price tends to be more volatile than other large companies.
- Investing in FAANG stocks does not provide a diversified exposure
- All these five stocks tend to move together. Meaning when one stock is falling all the five stocks are declining too
Also read:
- Best Preferred Stocks for to Buy Now
- Top 10 Shipping Stocks
- Best Agriculture Stocks to Buy
- Best Crypto Trading Signals
Overview of the FAANG Stocks:
Meta (Formerly known as Facebook)
- Market cap: $ 322.4 billion
- Dividend: Not Available
- EPS (earnings per share): 10.98 (Trailing 12 months)
- P/E ratio: 11.07(Trailing 12 months)
Facebook went public in 2012. Since then, it has grown to become the biggest social media platform in the world. The company’s primary revenue model is online advertising. Facebook earns through online advertisements. The company allows business owners to advertise their products on its platform for which it charges a fee. Today, Facebook has more than 2.9 billion monthly users. Such a vast user base has made online advertisement, specifically Facebook one of the most attractive platforms for advertisements. Penny stocks are also one of the best investment opportunities.
The company has monetized Facebook and Instagram. However, it has not monetized WhatsApp yet. Facebook has also recently invested in the virtual reality (VR) world by purchasing Oracular VR (in 2014).
What keeps Facebook ahead of the game is its continuous investment in machine learning and artificial intelligence. Check out this list of best AI stocks.
The below table shows the quarterly reports for the current year:
| Q3 2022 | Q2 2022 | Q1 2022 | |
| Revenue | $ 27.7 billion | $ 28.8 billion | $ 27.9 billion |
| Income from Operations | $ 5.7 billion | $ 8.4 billion | $ 8.5 billion |
| Net Income | $ 4.4 billion | $ 6.7 billion | $ 7.5 billion |
| Earnings per share | $ 1.64 | $ 2.46 | $ 2.72 |
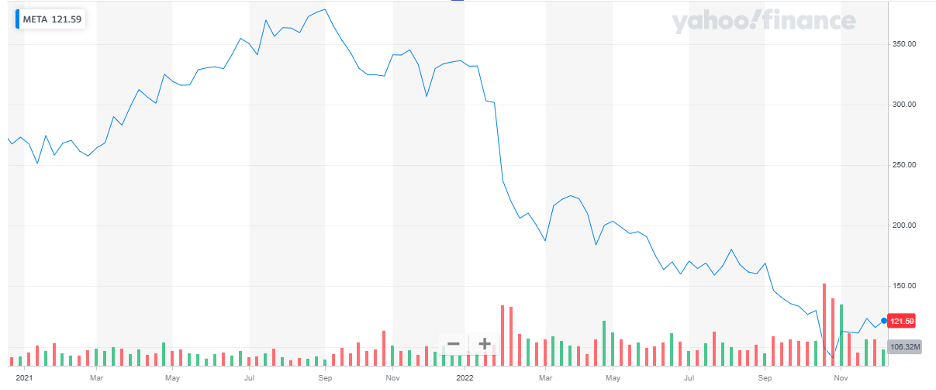
Meta has a market cap of $ 322.4 billion. Its shares are trading at $ 121.59.
The stock of the company enjoyed a bullish streak for a very long period till the last quarter of 2021. After that, the stock reversed course and has been declining. From $ 336.35 at the start of the year 2022, the stock recently closed at $ 121.59, representing a 64 % decline to date.
The below chart shows the performance of Meta stock in the past two years:
Checkout:
- Accurate and Reliable Gold Forecast
- Reliable and Trusted Commodity Signals
Amazon
- Market cap: $ 934.27 billion
- Dividend: Not Available
- EPS (earnings per share): 1.1 (Trailing 12 months)
- P/E ratio: 83.25 (Trailing 12 months)
Amazon is today the biggest e-commerce platform in the world, with 150 million users of its shopping app in the United States. Amazon has also invested in cloud computing through its Amazon Web Services, with more than 1 million users globally. The recent introduction of Amazon Prime, an online streaming service, has attracted a new customer base. Amazon Prime has more than 150 million users today.
Amazon also has consumer electronics under its brands such as Amazon Kindle and Amazon Echo. And it continues to invest in IoT solutions.
The below table shows the quarterly reports for the current year:
| Q3 2022 | Q2 2022 | Q1 2022 | |
| Revenue | $ 127.1 billion | $ 121.2 billion | $ 116.4 billion |
| Operating Income | $ 2.5 billion | $ 3.3 billion | $ 3.7 billion |
| Net Income/ Loss | $ 2.9 billion | ($ 2.1) billion | ($ 3.9) billion |
| Earnings per share | $ 0.28 | ($ 0.2) | ($ 7.56) |
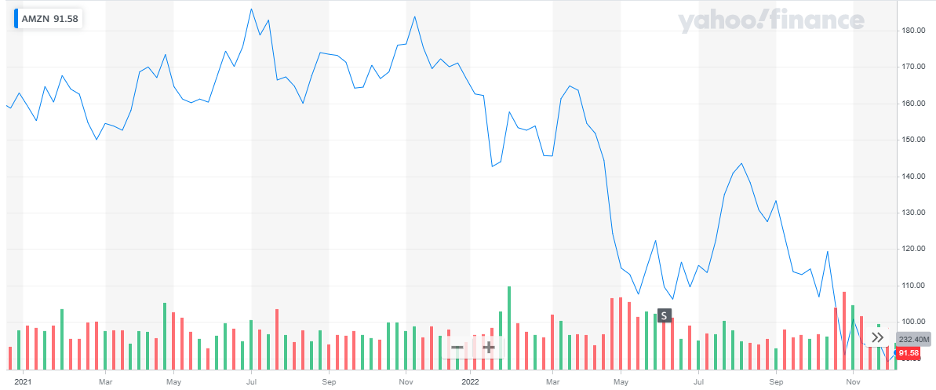
Amazon has a market cap of $ 934.27 billion. Its shares are trading at $ 91.58.
The stock was on a bullish streak for a very long. It started the year 2022 with the same trend at $ 166.72. After the first quarter, the stock reversed its course and started to decline. It recently closed at $ 91.58 representing a 45 % decline to date.
The below chart shows the performance of Amazon stock in the past two years:
Apple
- Market cap: $ 2.278 trillion
- Dividend: Not Available
- EPS (earnings per share): 6.11 (Trailing 12 months)
- P/E ratio: 23.44 (Trailing 12 months)
Apple sells personal computers, smartphones, and other electronics (iPads, iPods, smart watches, etc.). Currently, there are a billion iPhone users in the world. Unlike other personal computers and smartphone manufacturers, Apple manufactures its hardware and software (IOS).
Today the tech world is incomplete without Apple because it is on top of it. Apple not only manufactures and sells smartphones, tablets, headphones, and watches, but also digital content, and software and has become a leader in the “digital wallet” space.
Apple also has a music streaming app, Apple Music which alone has 72 million users. The tech giant also has invested in a cloud storage with its iCloud storage and TV streaming with Apple TV+. In 2020, a new lineup of 5G iPhones is expected to be launched.
The below table shows the quarterly reports for the current year:
| FY 2022 | Q4 2022 | Q3 2022 | Q2 2022 | Q1 2022 | |
| Revenue | $ 394.4 billion | $ 90.1 billion | $ 83 billion | $ 97.3 billion | $ 123.9 billion |
| Operating Income | $ 119.4 billion | $ 24.9 billion | $ 23 billion | $ 30 billion | $ 41.5 billion |
| Net Income/ Loss | $ 99.8 billion | $ 20.7 billion | $ 19.4 billion | $ 25 billion | $ 34.6 billion |
| Earnings per share | $ 6.15 | $ 1.29 | $ 1.2 | $ 1.54 | $ 2.11 |
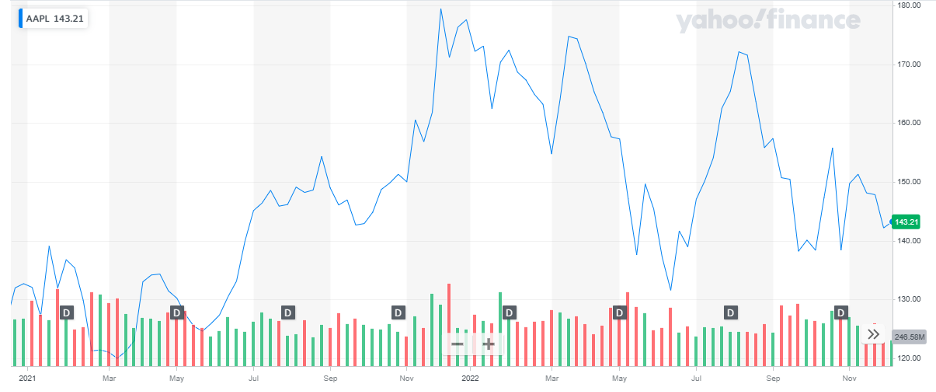
Apple has a market cap of $ 2.28 trillion. The stock of the company has been trading at $ 143.21.
The stock has been volatile in the current year. IT started off at $ 177.57, dropped to the lows of $ 131.56 during the year, and last closed at $ 143.21. To date, the stock has declined by 19.4 %.
The below chart shows the performance of Apple stock in the past two years:
Also read:
- Best Commodity Stocks to Buy Now
- Top Infrastructure Stocks to Invest in
- Best 3D Printing Stocks to Buy
Netflix
- Market cap: $ 141.44 billion
- Dividend: Not Available
- EPS (earnings per share): 1.35 (Trailing 12 months)
- P/E ratio: 28 (Trailing 12 months)
Netflix started online movie streaming services in 2007. Before that, it was just a DVD rental. Today Netflix has 223 million paid subscribers worldwide
In the past few years, Netflix has started to create its content to cater to the change in the industry and beat the competition.
The below table shows the quarterly reports for the current year:
| Q3 2022 | Q2 2022 | Q1 2022 | |
| Revenue | $ 8 billion | $ 8 billion | $ 7.9 billion |
| Operating Income | $ 1.53 billion | $ 1.578 billion | $ 1.971 billion |
| Net Income/ Loss | $ 1.4 billion | $ 1.44 billion | $ 1.597 billion |
| Earnings per share | $ 3.14 | $ 3.24 | $ 3.6 |
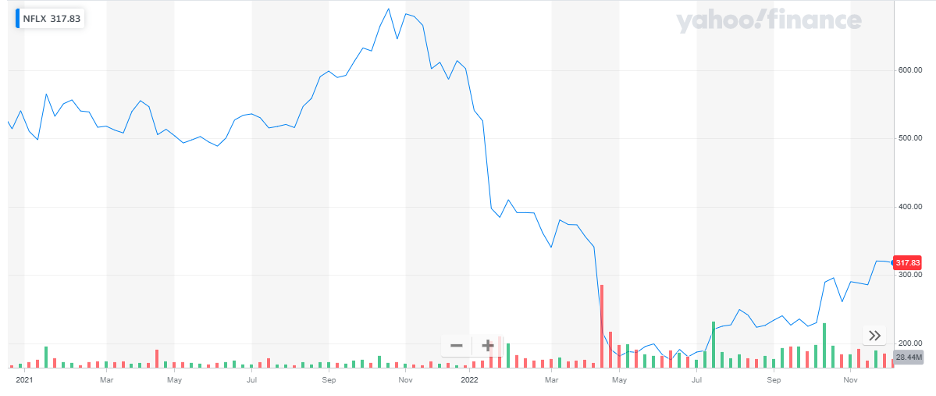
Netflix has a market cap of $ 141.4 billion. Its shares are trading at $ 317.83.
After staying bullish for a prolonged period, the stock suffered a huge drop when 2022 started. The stock started off the year at $ 602.44. During the year, the stock dropped to a low of $ 175.51 and eventually closed at $ 314.2. To date, the stock declined by 48 %.
The below chart shows the performance of Netflix stock in the past two years:
Google (Alphabet)
- Market cap: $ 1.23 trillion
- Dividend: Not Available
- EPS (earnings per share): 5.16 (Trailing 12 months)
- P/E ratio: 18.42 (Trailing 12 months)
Google, now formerly managed under the parent company Alphabet, is the number one search engine in the world with 3.5 billion searches every day. Google also owns YouTube, a video sharing, and social media platform with 2 billion monthly users. Google also owns Google Maps, Google Play store, Google Drive, and Google Chrome, among other services.
Google’s main revenue driver is advertising displayed through its search engine and other apps. It also has investments in biotechnology, self-driving cars, and smart cities.
The below table shows the quarterly reports for the current year:
| Q3 2022 | Q2 2022 | Q1 2022 | |
| Revenue | $ 69 billion | $ 69.7 billion | $ 68 billion |
| Operating Income | $ 17 billion | $ 19.45 billion | $ 20 billion |
| Net Income/ Loss | $ 13.9 billion | $ 16 billion | $ 16.4 billion |
| Earnings per share | $ 1.07 | $ 1.22 | $ 24.9 |
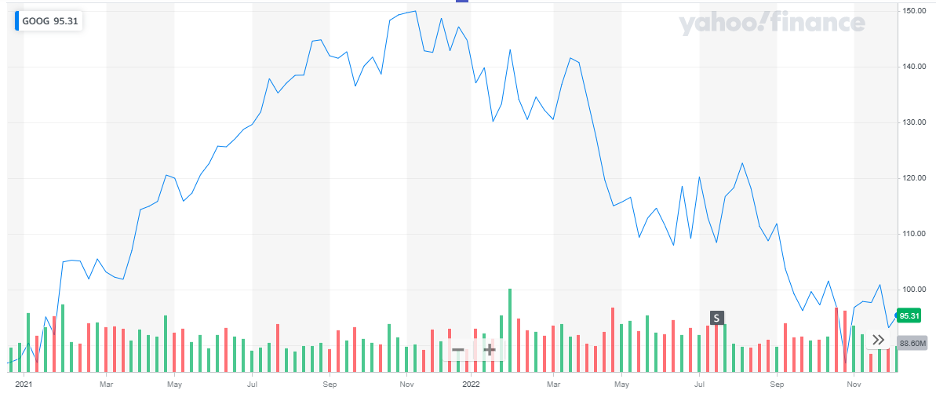
Google has a market cap of $ 1.232 trillion. Its shares are trading at $ 95.31.
The stock of the company remained bullish for the whole of 2021. In the current year, the stock picked up a bearish trend. The stock started the year 2022 at $ 144.68 and last closed at $ 94. To date, the stock has declined by 35 %.
The below chart shows the performance of Google stock in the past two years:
Final Words
FAANG stocks are some of the biggest names in the world. Like every investment, they come with their risks and rewards. Therefore, investors should be well-aware before adding them to their portfolios.
These stocks remain extremely influential. Because of the volatility of these stocks, investors should have a high-risk tolerance for their investments. The growth of these companies owes to the popularity of the underlying technology, products, and applications of these companies. They are continuously evolving and tapping new areas like cloud computing and artificial intelligence. This constant push towards the next new thing makes these tech stocks highly growth-oriented.
Nonetheless, these stocks are not magic. They need to be dealt with like other stocks with caution and good research of the company and the market.
You may also like reading.
- Top Stock Indicators for Stock Trading
- Best Drone Stocks to Invest
- Best Trading and Forex Signal Providers
- Best Forex Indicators for Forex Currency Trading
- Best Stock Forecasts & Prediction Websites
- Best Uranium Stocks to Invest
- Best Travel & Tourism Stocks to Buy
