

What are Energy ETFs?
An energy ETF is an exchange-traded fund that invests in stocks in the energy sector. These companies are involved in the exploration, production, or management of energy resources, including oil and natural gas, alternative energy companies such as wind farms or solar panel producers, and utility companies. Here are the top 10 energy ETFs to buy in 2024:
| Sr. | Fund name | Symbol | Assets Under Management | Price |
| 1 | Energy Select Sector SPDR Fund | XLE | $ 41.6 billion | $ 90.01 |
| 2 | Invesco Solar ETF | TAN | $ 76.53 | |
| 3 | First Trust NASDAQ Clean Edge Green Energy Idx Fd ETF | QCLN | $ 1.78 billion | $ 56.31 |
| 4 | SPDR S&P Oil & Gas Exploration & Production ETF | XOP | $ 4.03 billion | $ 140.63 |
| 5 | Invesco S&P 500 Equal Weight Energy ETF | RYE | $ 588.01 million | $ 74.92 |
| 6 | VanEck Oil Services ETF | OIH | $ 2.8 billion | $ 330.72 |
| 7 | Fidelity MSCI Energy ETF | FENY | $ 1.71 billion | $ 25.42 |
| 8 | iShares Global Energy ETF | IXC | $ 2.1 billion | $ 40.68 |
| 9 | SmartETFs Sustainable Energy II ETF | SOLR | $ 5.7 million | $ 31.75 |
| 10 | Alerian MLP ETF | AMLP | $ 6.68 billion | $ 40.63 |
 Energy Select Sector SPDR Fund
The Energy Select Sector SPDR Fund represents 23 companies from the S&P 500 that belong to the oil, gas, and consumable fuels or energy equipment and services industries. The fund’s top holding includes blue-chip stocks, such as Exxon Mobile Corp., Chevron Corp., ConocoPhillips, and EOG Resources Inc. The fund was created on Dec 1998 and has an expense ratio of 0.1 %. The total Assets under management for this fund are $ 41.6 billion. The below graph shows the NAV of the fund and the energy sector as a whole: 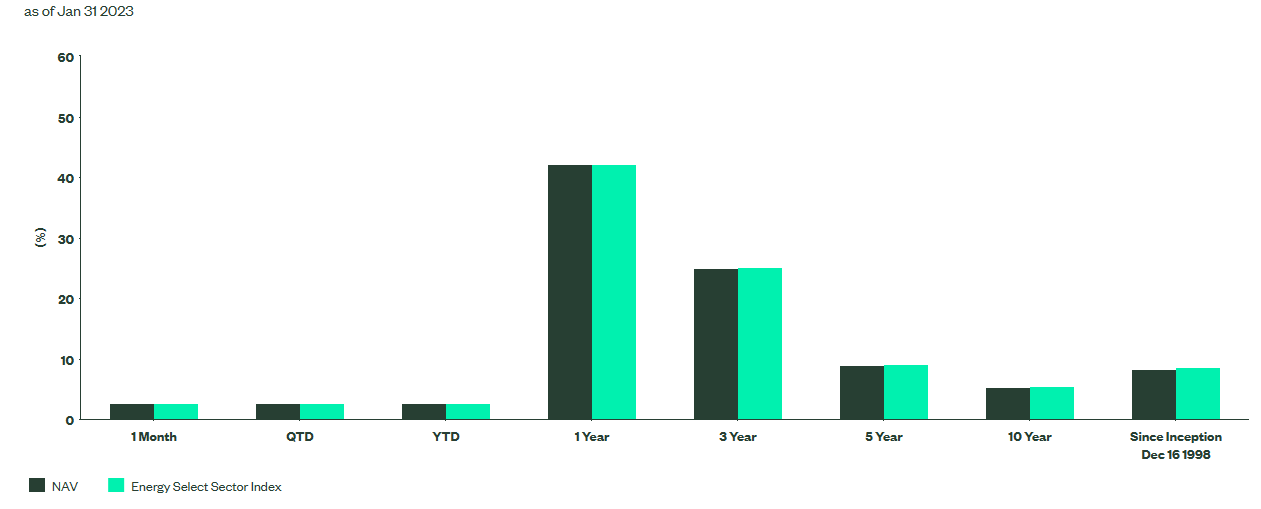
| As Of | 1 Month | QTD | YTD | 1 Year | 3 Year | 5 Year | 10 Year | Since Inception | |
| NAV | Jan 31, 2023 | 2.69 % | 2.69 % | 2.69 % | 42.12 % | 24.96 % | 8.9 % | 5.35 % | 8.34 % |
| Market Value | Jan 31, 2023 | 2.70 % | 2.70 % | 2.70 % | 42.2 % | 25 % | 8.90 % | 5.34 % | 8.34 % |
| Energy Select Sector Index | Jan 31, 2023 | 2.69 % | 2.69 % | 2.69 % | 42.23 % | 25.1 % | 9.03 % | 5.47 % | 8.56 % |
The below chart shows the top holdings of the fund:
| Sr. | Name | Shares Held | Weight |
| 1 | Exxon Mobil Corporation | 83,970,390 | 23.89 % |
| 2 | Chevron Corporation | 45,167,750 | 18.65 % |
| 3 | Schlumberger NV | 36,215,830 | 5.01 % |
| 4 | EOG Resources Inc. | 13,980,913 | 4.50 % |
| 5 | ConocoPhillips | 15,461,347 | 4.19 % |
| 6 | Marathon Petroleum Corporation | 13,441,437 | 4.15 % |
| 7 | Pioneer Natural Resources Company | 6,814,462 | 3.83 % |
| 8 | Valero Energy Corporation | 11,056,996 | 3.73 % |
| 9 | Phillips 66 | 13,555,327 | 3.54 % |
| 10 | Occidental Petroleum Corporation | 20,854,496 | 3.26 % |
| 11 | Exxon Mobil Corporation | 83,970,390 | 23.89 % |
Also, learn:
Invesco Solar ETF
The Invesco Solar ETF (Fund) is based on the MAC Global Solar Energy Index (Index). The Fund will invest at least 90% of its total assets in the securities, American depositary receipts (ADRs), and global depositary receipts (GDRs) that comprise the Index. The Index is comprised of companies in the solar energy industry. The index is computed using the net return, which withholds applicable taxes for non-resident investors. The fund was created on April 2008 and has an expense ratio of 0.69 %. The below graph shows the NAV and market price of the fund and the energy sector as a whole: 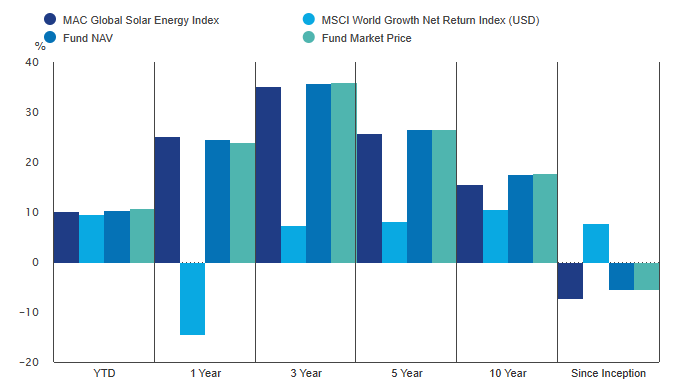
| YTD | 1 Year | 3 Year | 5 Year | 10 Year | Since Inception | |
| ETF NAV | – 5.18 % | – 5.18 % | 33.5 % | 24.16 % | 18.25 % | – 6.16 % |
| ETF Market Price | – 5.47 % | – 5.47 % | 33.32 % | 24.03 % | 18.12 % | -6.17 % |
| Underlying Index | -4.75 % | -4.75 % | 33.05 % | 23.41 % | 16.23 % | -7.75 % |
| Benchmark | -29.21 % | -29.21 % | 4.71 % | 7.43 % | 10.08 % | 7.17 % |
The below chart shows the top holdings of the fund:
| Sr. | Name | Symbol | Weight |
| 1 | First Solar Inc | FSLR | 11.34 % |
| 2 | SolarEdge Technologies Inc | SEDG | 10.02 % |
| 3 | Enphase Energy Inc | ENPH | 6.81 % |
| 4 | Xinyi Solar Holdings Ltd | 968 HK | 5.49 % |
| 5 | GCL Technology Holdings Ltd | 3800 HK | 5.49 % |
| 6 | Sunrun Inc | RUN | 4.68 % |
| 7 | Array Technologies Inc | ARRY | 3.31 % |
| 8 | Shoals Technologies Group Inc | SHLS | 3.13 % |
| 9 | Encavis AG | ECV | 2.87 % |
| 10 | Daqo New Energy Corp ADR | DQ | 2.86 % |
Checkout:
- Accurate and Reliable Gold Forecast
- Reliable and Trusted Commodity Signals
First Trust NASDAQ Clean Edge Green Energy Idx Fd ETF
QCLN holds a broad portfolio of US-listed firms in the clean energy industry. Eligible companies must be manufacturers, developers, distributors, or installers of one of the following four sub-sectors: advanced materials (that enable clean energy or reduce the need for petroleum products), energy intelligence (smart grid), energy storage and conversion (hybrid batteries), or renewable electricity generation (solar, wind, geothermal, etc). The fund was created on October 2014 and has an expense ratio of 0.79 %. The total Assets under management for this fund are $ 41.6 billion. This chart shows how units of the ETF performed in each of the past 7 years: 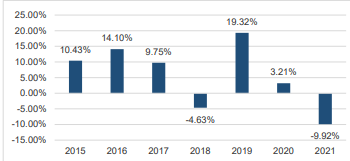
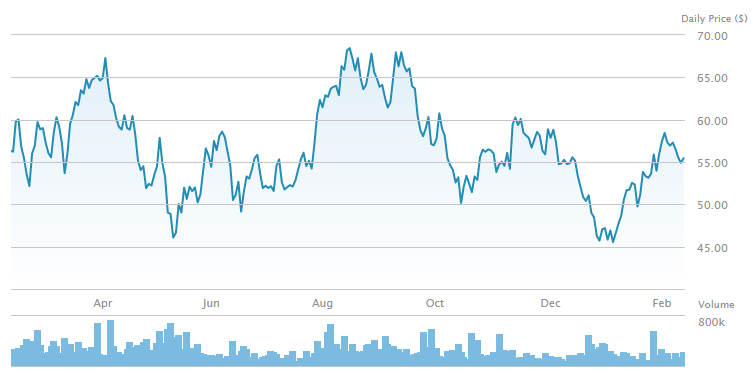 The below chart shows the price performance of the ETF over the past year:
| PERFORMANCE [as of 02/13/23] | 1 month | 3 Months | YTD | 1 Year | 3 Years | 5 Years | 10 Years |
| QCLN | 7.19 % | -7.82 % | 17.50 % | -1.31 % | 24.23 % | 24.17 % | 18.35 % |
| QCLN (NAV) | 7.15 % | -7.86 % | 17.60 % | -1.25 % | 24.33 % | 24.22 % | 18.31 % |
| NASDAQ Clean Edge Green Energy Index | 7.10 % | -7.87 % | 17.56 % | -1.03 % | 24.85 % | 24.56 % | 18.40 % |
The below chart shows the top holdings of the fund:
| Sr. | Name | Weight |
| 1 | ON Semiconductor Corporation | 9.6 % |
| 2 | Tesla, Inc. | 8.55 % |
| 3 | Albemarle Corporation | 8.31 % |
| 4 | Enphase Energy, Inc. | 5.67 % |
| 5 | Rivian Automotive Inc. Class A | 5.05 % |
| 6 | SolarEdge Technologies, Inc. | 4.45 % |
| 7 | Lucid Group Inc. | 4.3 % |
| 8 | First Solar | 4.15 % |
| 9 | Wolfspeed, Inc. | 3.31 % |
| 10 | Plug Power Inc. | 3.01 % |
Checkout:
- Best crypto signals
- Best undervalued stocks
- Best stock indicators
- Top trading blogs
- Best regional bank stocks
SPDR S&P Oil & Gas Exploration & Production ETF
The SPDR® S&P® Oil & Gas Exploration & Production ETF seeks to provide investment results that, before fees and expenses, correspond generally to the total return performance of the S&P® Oil & Gas Exploration & Production Select Industry® Index (the “Index”). It seeks to provide exposure to the oil and gas exploration and production segment of the S&P TMI, which comprises the following sub-industries: Integrated Oil & Gas, Oil & Gas Exploration & Production, and Oil & Gas Refining & Marketing. By investing in this index, investors can take strategic or tactical positions at a more targeted level than traditional sector-based investing. The fund was created on June 2006 and has an expense ratio of 0.35 %. The total Assets under management for this fund are $ 4.03 billion. 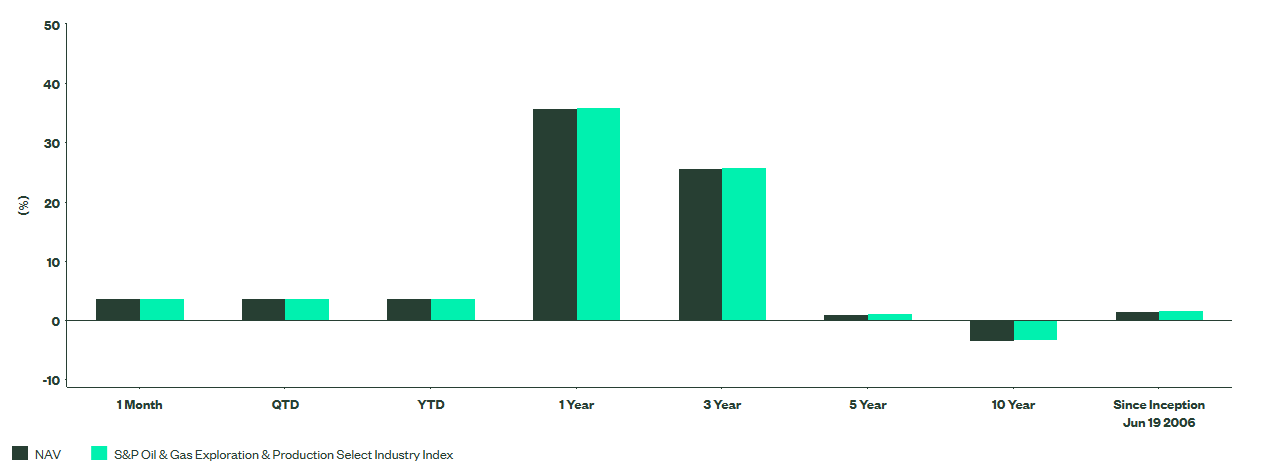
| As Of | 1 Month | QTD | YTD | 1 Year | 3 Year | 5 Year | 10 Year | Since Inception | |
| NAV | Jan 31, 2023 | 3.75 % | 3.75 % | 3.75 % | 35.77 % | 25.61 % | 0.99 % | -3.45 % | 1.42 % |
| Market Value | Jan 31, 2023 | 3.76 % | 3.76 % | 3.76 % | 35.87 % | 25.60 % | 0.98 % | -3.45 % | 1.42 % |
| S&P Oil & Gas Exploration & Production Select Industry Index | Jan 31, 2023 | 3.77 % | 3.77 % | 3.77 % | 36.02 % | 25.85 % | 1.20 % | -3.31 % | 1.60 % |
The below chart shows the top holdings of the fund:
| Sr. | Name | Shares Held | Weight |
| 1 | PBF Energy Inc. Class A | 2,463,931 | 2.58 % |
| 2 | Kosmos Energy Ltd. | 12,792,225 | 2.56 % |
| 3 | Permian Resources Corporation Class A | 9,325,845 | 2.44 % |
| 4 | Valero Energy Corporation | 699,553 | 2.43 % |
| 5 | Callon Petroleum Company | 2,345,043 | 2.41 % |
| 6 | Marathon Petroleum Corporation | 750,777 | 2.39 % |
| 7 | Civitas Resources Inc. | 1,428,651 | 2.36 % |
| 8 | Matador Resources Company | 1,465,402 | 2.36 % |
| 9 | Diamondback Energy Inc. | 618,833 | 2.28 % |
| 10 | Exxon Mobil Corporation | 774,589 | 2.27 % |
Invesco S&P 500 Equal Weight Energy ETF
The Invesco S&P 500 Equal Weight Energy ETF (Fund) is based on the S&P 500 Equal Weight Energy Plus Index (Index). The Fund will invest at least 90 % of its total assets in common stocks that comprise the Index. The Index equally weights stocks in the energy sector of the S&P 500 Index. The energy sector includes companies engaged in the exploration and production, refining and marketing, and storage and transportation of oil and gas and coal and consumable fuels, as well as companies that offer oil and gas equipment and services. The fund was created on November 2006 and has an expense ratio of 0.4 %. The total Assets under management for this fund are $ 4.03 billion. 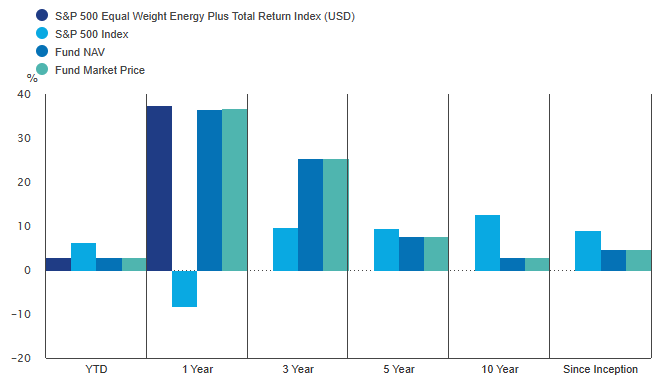
| PERFORMANCE [as of 02/13/23] | YTD | 1 Year | 3 Years | 5 Years | 10 Years | Since Inception |
| Fund Market Price | 3.00 % | 36.76 % | 25.47 % | 7.70 % | 3.00 % | 4.69 % |
| Fund NAV | 2.99 % | 36.66 % | 25.44 % | 7.70 % | 3.01 % | 4.69 % |
| S&P 500 Equal Weight Energy Plus Total Return Index (USD) | 3.02 % | 37.44 % | N/A | N/A | N/A | N/A |
The below chart shows the top holdings of the fund:
| Sr. | Name | Symbol | Weight |
| 1 | Schlumberger Ltd | SLB | 4.87 % |
| 2 | Valero Energy Corp | VLO | 4.87 % |
| 3 | Baker Hughes Co | BKR | 4.83 % |
| 4 | Marathon Petroleum Corp | MPC | 4.78 % |
| 5 | Halliburton Co | HAL | 4.75 % |
| 6 | Diamondback Energy Inc | FANG | 4.57 % |
| 7 | Exxon Mobil Corp | XOM | 4.54 % |
| 8 | Hess Corp | HES | 4.54 % |
| 9 | Targa Resources Corp | TRGP | 4.46 % |
| 10 | Phillips 66 | PSX | 4.41 % |
Checkout:
- Best drone stocks
- Forex Signals providers
- Best NFT stocks
- Best swing trading stocks
- Technical analysis books
VanEck Oil Services ETF
VanEck Oil Services ETF (OIH) seeks to replicate as closely as possible, before fees and expenses, the price and yield performance of the MVIS® US Listed Oil Services 25 Index (MVOIHTR), which is intended to track the overall performance of U.S.-listed companies involved in oil services to the upstream oil sector, which include oil equipment, oil services, or oil drilling. The fund was created on Dec 2011 and has an expense ratio of 0.35 %. The below chart shows the price performance of the ETF over the past few years: 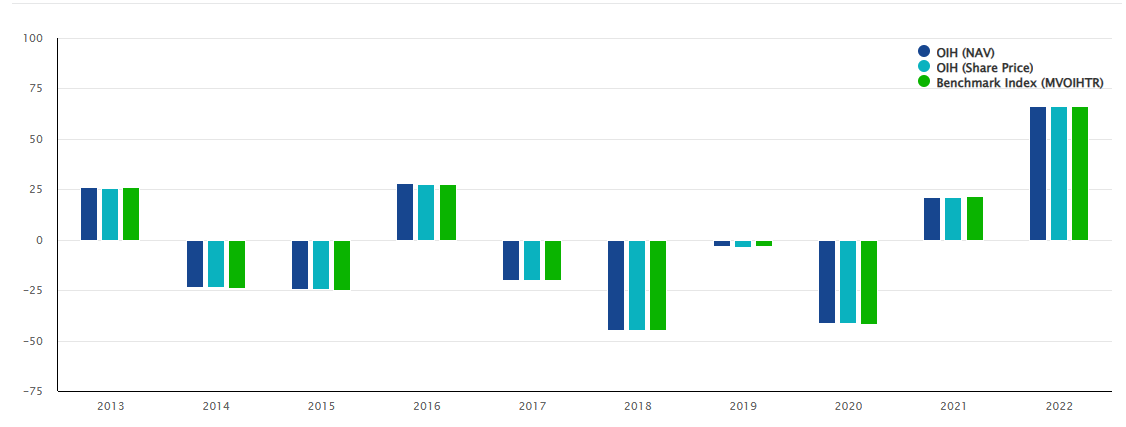
| 1 MO | 3 MO | YTD | 1 Year | 3 Year | 5 Year | 10 Year | Since Inception | |
| OIH (NAV) | 8.58 % | 11.68 % | 8.58 % | 47.71 % | 16.02 % | – 8.32 % | – 7.68 % | -5.71 % |
| OIH (Share Price) | 8.55 % | 11.55 % | 8.55 % | 47.55 % | 16.03 % | – 8.34 % | – 7.69 % | -5.64 % |
| MVOIHTR (Index) | 8.61 % | 11.79 % | 8.61 % | 48.04 % | 15.89 % | – 8.37 % | – 7.79 % | -5.80 % |
The below chart shows the top holdings of the fund:
| Sr. | Holding Name | Symbol | Number of shares | Weightage |
| 1 | Schlumberger Nv | SLB US | 9,879,334 | 19.38 % |
| 2 | Halliburton Co | HAL US | 7,974,131 | 11.31 % |
| 3 | Baker Hughes Co | BKR US | 7,621,911 | 8.33 % |
| 4 | Transocean Ltd | RIG US | 26,018,161 | 6.04 % |
| 5 | Nov Inc | NOV US | 6,050,063 | 5.09 % |
| 6 | Tenaris Sa | TS US | 3,815,071 | 4.66 % |
| 7 | Technipfmc Plc | FTI US | 9,684,860 | 4.63 % |
| 8 | Valaris Ltd | VAL US | 1,819,803 | 4.55 % |
| 9 | Championx Corp | CHX US | 3,922,691 | 4.46 % |
| 10 | Helmerich & Payne Inc | HP US | 2,429,177 | 4.05 % |
Fidelity MSCI Energy ETF
FENY is part of a fund suite that marked Fidelity’s official entry into the US sector ETF market. The fund offers a top-heavy portfolio in the US energy segment, with well over half of its portfolio weight in its top ten holdings, and a huge chunk of its allocation to the top few. Overall, its portfolio is broad, with allocations to every aspect of the oil and gas industries, and some allocations dedicated to coal and renewables. On December 1, 2020, FENY started tracking a capped version of its previous index, where the aggregate weight of issuers with over 5% weight in the index is now capped at 50% of the fund’s total assets. The fund uses a sampling strategy to track the index, which means the fund may not hold all the securities in the underlying index, but securities that provide a similar investment profile. The fund was created on October 2.13 and has an expense ratio of 0.08 %. Total Assets under management for this fund are $ 1.71 billion. The below chart shows the price performance of the chart over the past five years: 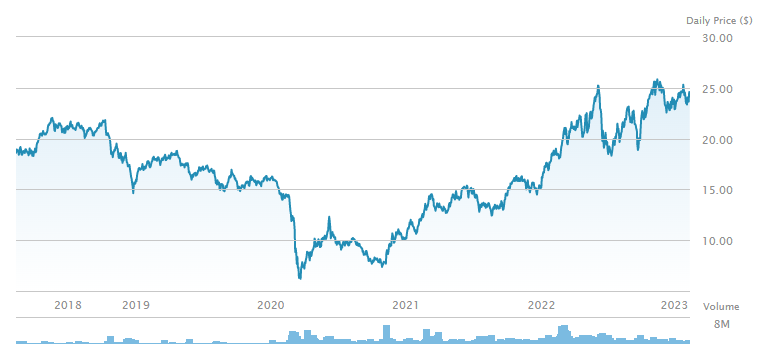
| 1 MO | 3 MO | YTD | 1 Year | 3 Year | 5 Year | |
| FENY | 0.04 % | -3.54 % | 2.73 % | 33.78 % | 24.55 % | 10.40 % |
| FENY (NAV) | 0.06 % | -3.54 % | 2.75 % | 33.80 % | 24.59 % | 10.39 % |
The below chart shows the top holdings of the fund:
| Sr. | Holding Name | Weightage |
| 1 | Exxon Mobil Corp | 23.31 % |
| 2 | Chevron Corporation | 14.94 % |
| 3 | Conoco Phillips | 6.4 % |
| 4 | Schlumberger NV | 3.97 % |
| 5 | EOG Resources, Inc. | 3.83 % |
| 6 | Marathon Petroleum Corporation | 3.81 % |
| 7 | Occidental Petroleum Corporation | 2.96 % |
| 8 | Valero Energy Corporation | 2.78 % |
| 9 | Pioneer Natural Resources Company | 2.62 % |
| 10 | Phillips 66 | 2.55 % |
Also read:
- Best day trading stocks
- Best stock advisor service
- Best forex indicators
- Best preferred stocks
- Best penny stocks to invest in
- Best crypto day trading strategies
iShares Global Energy ETF
The iShares Global Energy ETF seeks to track the investment results of an index composed of global equities in the energy sector. The fund was created on November 2001 and has an expense ratio of 0.4 %.
| 1 Year | 3 Year | 5 Year | 10 Year | Since Inception | |
| Total Return | 47.82 % | 13.01 % | 6.73 % | 4.11 % | 7.10 % |
| Market Price | 48.49 % | 13.05 % | 6.77 % | 4.09 % | 7.10 % |
| Benchmark Index | 46.83 % | 12.36 % | 6.19 % | 3.80 % | 6.82 % |
The below chart shows the top holdings of the fund:
| Sr. | Holding Name | Weightage |
| 1 | Exxon Mobil Corp | 16.63 % |
| 2 | Chevron Corporation | 11.69 % |
| 3 | Shell | 7.28 % |
| 4 | Total Energies | 5.64 % |
| 5 | Conoco Philips | 5.38 % |
| 6 | BP Plc. | 3.82 % |
| 7 | Enbridge Plc. | 2.9 % |
| 8 | EOG Resources | 2.79 % |
| 9 | Schlumberger NV | 2.77 % |
| 10 | Canadian Natural Resources | 2.25 % |
SmartETFs Sustainable Energy II ETF
The SmartETFs Sustainable Energy II ETF seeks long-term appreciation by investing in equity securities of companies that provide or support alternative or renewable sources of energy. This includes companies that provide or support alternative or renewable sources of energy (as compared to more traditional sources of energy that can be environmentally depletive, such as fossil fuels like oil or coal or other hydrocarbon-based fuels), or that produce, generate, transport, deliver, or extend energy applications in a way that makes alternative or renewable energy more efficient or accessible. The ETF is actively managed and fully transparent, investing in 30 approximately equally weighted positions on a global basis. The fund was created on November 2020 and has an expense ratio of 0.79 %.
| 1 Month | 6 Months | YTD | 1 year | Since inception | |
| SOLR at NAV | 9.91 % | 8.2 % | 9.91 % | 9.58 % | 11.75 % |
| SOLR at Market Price | 9.99 % | 7.95 % | 9.99 % | 9.21 % | 12.86 % |
| MSCI World NR | 7.08 % | 2.15 % | 7.08 % | -7.45 % | 5.99 % |
The below chart shows the top holdings of the fund:
| Sr. | Holding Name | Weightage |
| 1 | First Solar | 4.92 % |
| 2 | Iberdrola SA | 4.55 % |
| 3 | Infineon Technologies AG | 4.53 % |
| 4 | Schbeider Electric SE | 4.37 % |
| 5 | ON Semiconductor Inc | 4.16 % |
| 6 | Canadian Solar Inc | 4.06 % |
| 7 | Trane Technologies PLC | 3.99 % |
| 8 | Hubbell Inc. | 3.94 % |
| 9 | Eaton Corp Plc. | 3.93 % |
| 10 | Nextera Energy Inc. | 3.88 % |
Check out the best gold trading signal providers.
Alerian MLP ETF
AMLP seeks to invest in energy infrastructure MLPs, selected by distributions. The companies listed in its market-cap-weighted index earn the majority of their cash flow from midstream activities involving energy commodities. Structured as a C-corporation, the fund allows full allocation to MLPs, unlike traditional ETFs that can only hold 25 % of their portfolios in MLPs. However, this structure introduces a layer of taxation that prevents it from passing through the full return of its underlying index. Therefore, AMLP provides diluted exposure to its MLPs. This, however, benefits shareholders—most distributions are tax-deferred, similar to the underlying MLPs, and in contrast to ETNs. The fund was created on August 2010 and has an expense ratio of 0.87 %.
| 1 Month | 3 months | YTD | 1 year | 3 years | 5 years | 10 years | |
| AMLP | 1.95 % | 0.37 % | 7.46 % | 13.73 % | 10.42 % | 2.81 % | 0.50 % |
| AMLP (NAV) | 1.97 % | 0.37 % | 7.62 % | 13.89 % | 10.55 % | 2.83 % | 0.50 % |
The below chart shows the top holdings of the fund:
| Sr. | Holding Name | Weightage |
| 1 | Energy Transfer LP | 10.74 % |
| 2 | Enterprise Products Partners L.P. | 10.72 % |
| 3 | Western Midstream Partners, LP | 10.71 % |
| 4 | Plains All American Pipeline, L.P. | 10.65 % |
| 5 | MPLX LP | 10.52 % |
| 6 | Magellan Midstream Partners, L.P. | 10.33 % |
| 7 | EnLink Midstream LLC | 8.96 % |
| 8 | DCP Midstream LP | 8.4 % |
| 9 | Cheniere Energy Partners, L.P. | 5.67 % |
| 10 | Crestwood Equity Partners LP | 4.9 % |
Also read:


