

XBI holds a clear bullish structure while wave I keeps expanding. Moreover, the rally from 118 to 165 shows that institutional demand returned to biotech with force. As a result, price action maintains impulsive sequences and controlled pullbacks, which fit a trend that still shows no exhaustion.
At the same time, fundamentals support the move. For example, large pharmaceutical companies continue accelerating acquisitions to strengthen pipelines ahead of major patent expirations. Likewise, expected rate cuts lower financing costs for clinical‑stage biotechs. With both forces aligned, XBI could maintain its current trend through the end of 2026.
Elliott Wave Structure: XBI Weekly Chart June 1st 2026
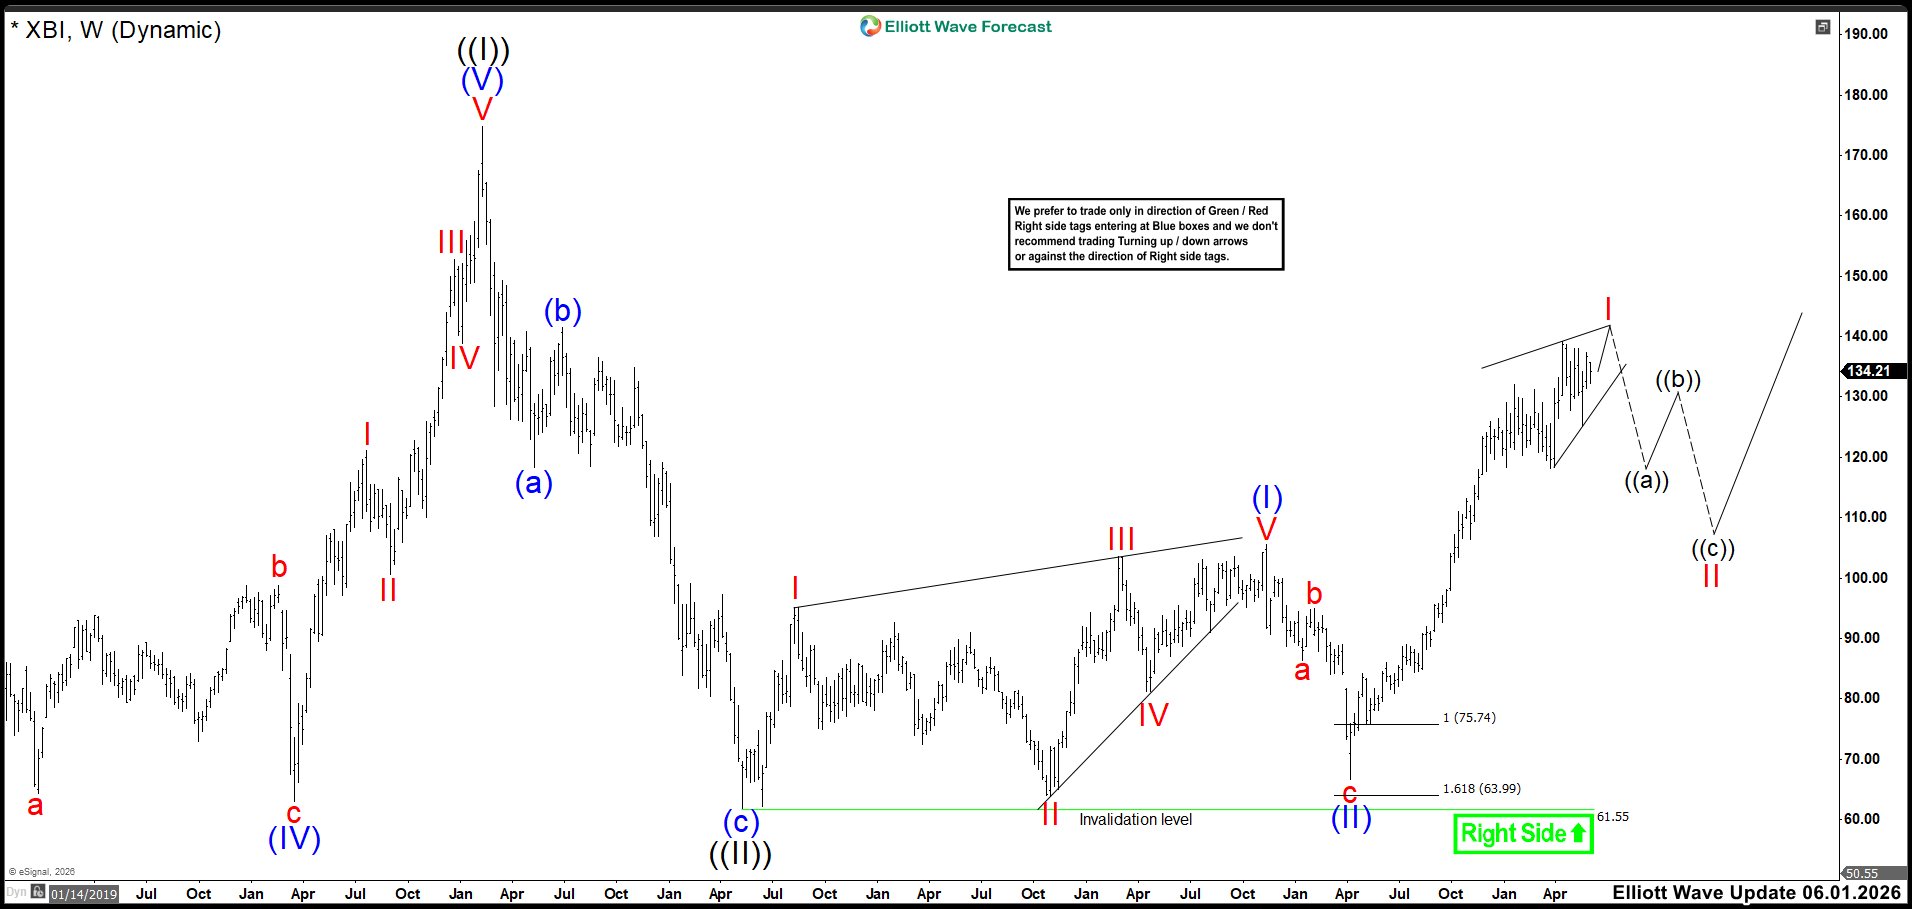
In June, we expected XBI to show lagging momentum, signaling that a correction was approaching. Back then, only a strong bullish push could invalidate that view. We also anticipated wave I to complete a leading diagonal with one final high near 142.60. If price reacted sharply lower at that level, we would consider wave I complete and the correction underway.
At the time, we noted that if no bearish reaction appeared and momentum kept lagging, additional upside remained possible. Even so, the broader structure still favored a pending correction before the next bullish phase.
If you’re eager to dive deeper into Elliott Wave Theory and learn how its principles apply to market forecasting, you might find these resources helpful: and .
Elliott Wave Principle Behind the Market Structure
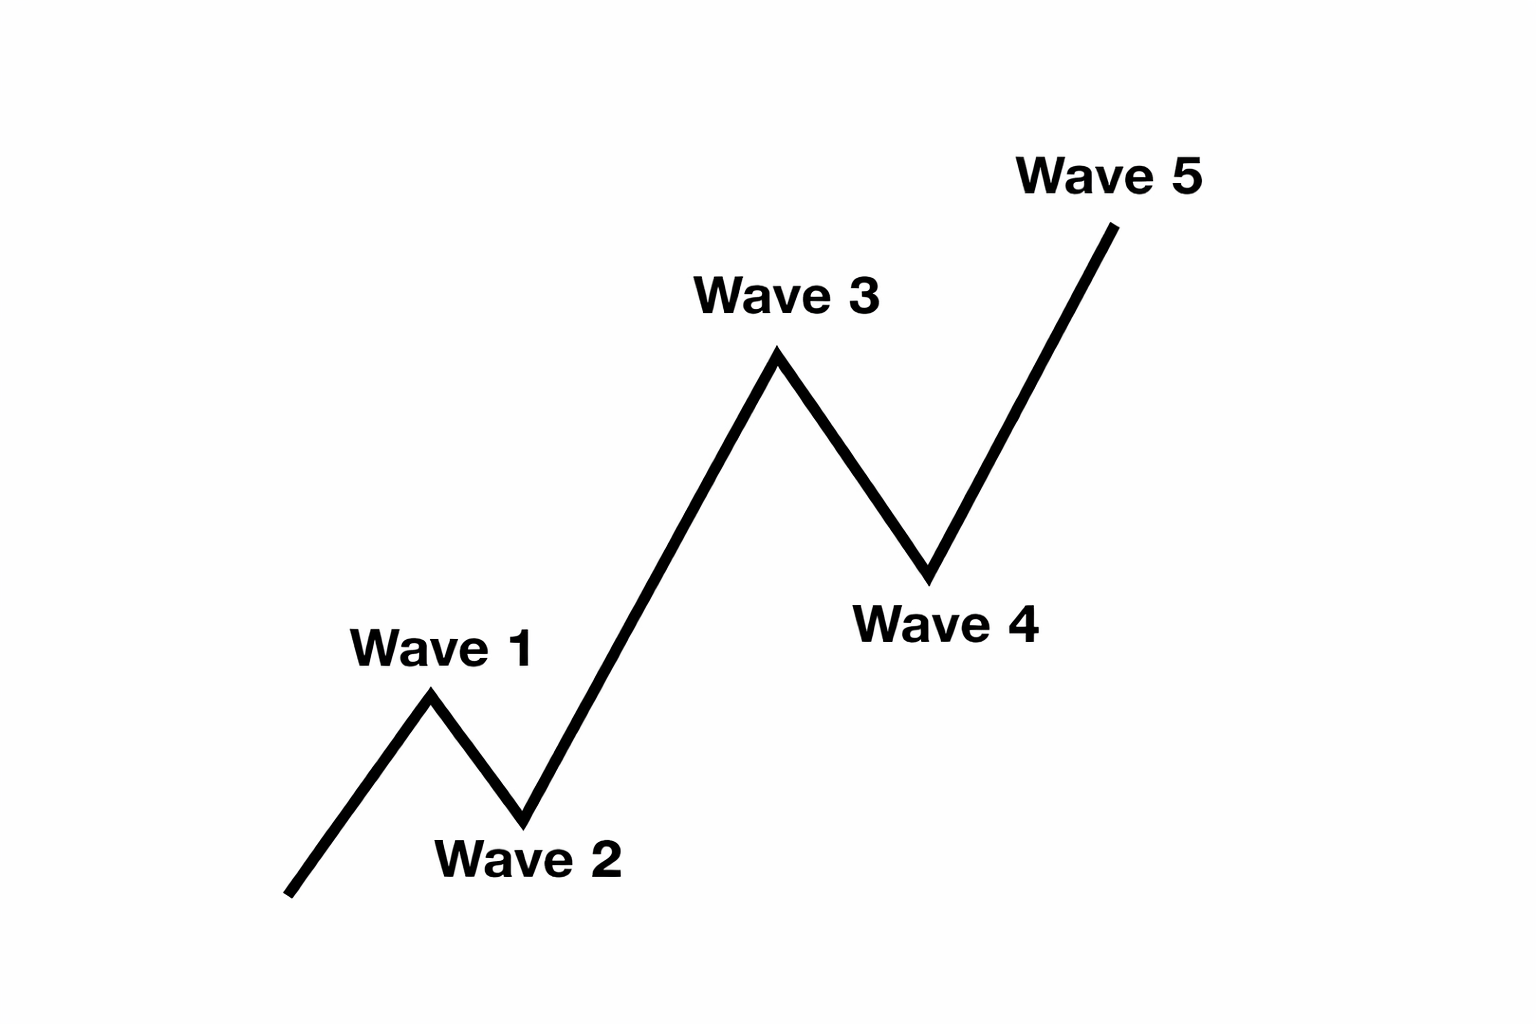
Impulse
An impulse is a clean 5‑wave pattern that drives the trend forward.
- Waves 1‑3‑5 are strong and directional.
- No overlap between waves 1 and 4.
- Wave 3 is usually the strongest.
- Structure is clear, with increasing momentum.
Elliott Wave Structure: XBI Weekly Chart August 22nd 2026
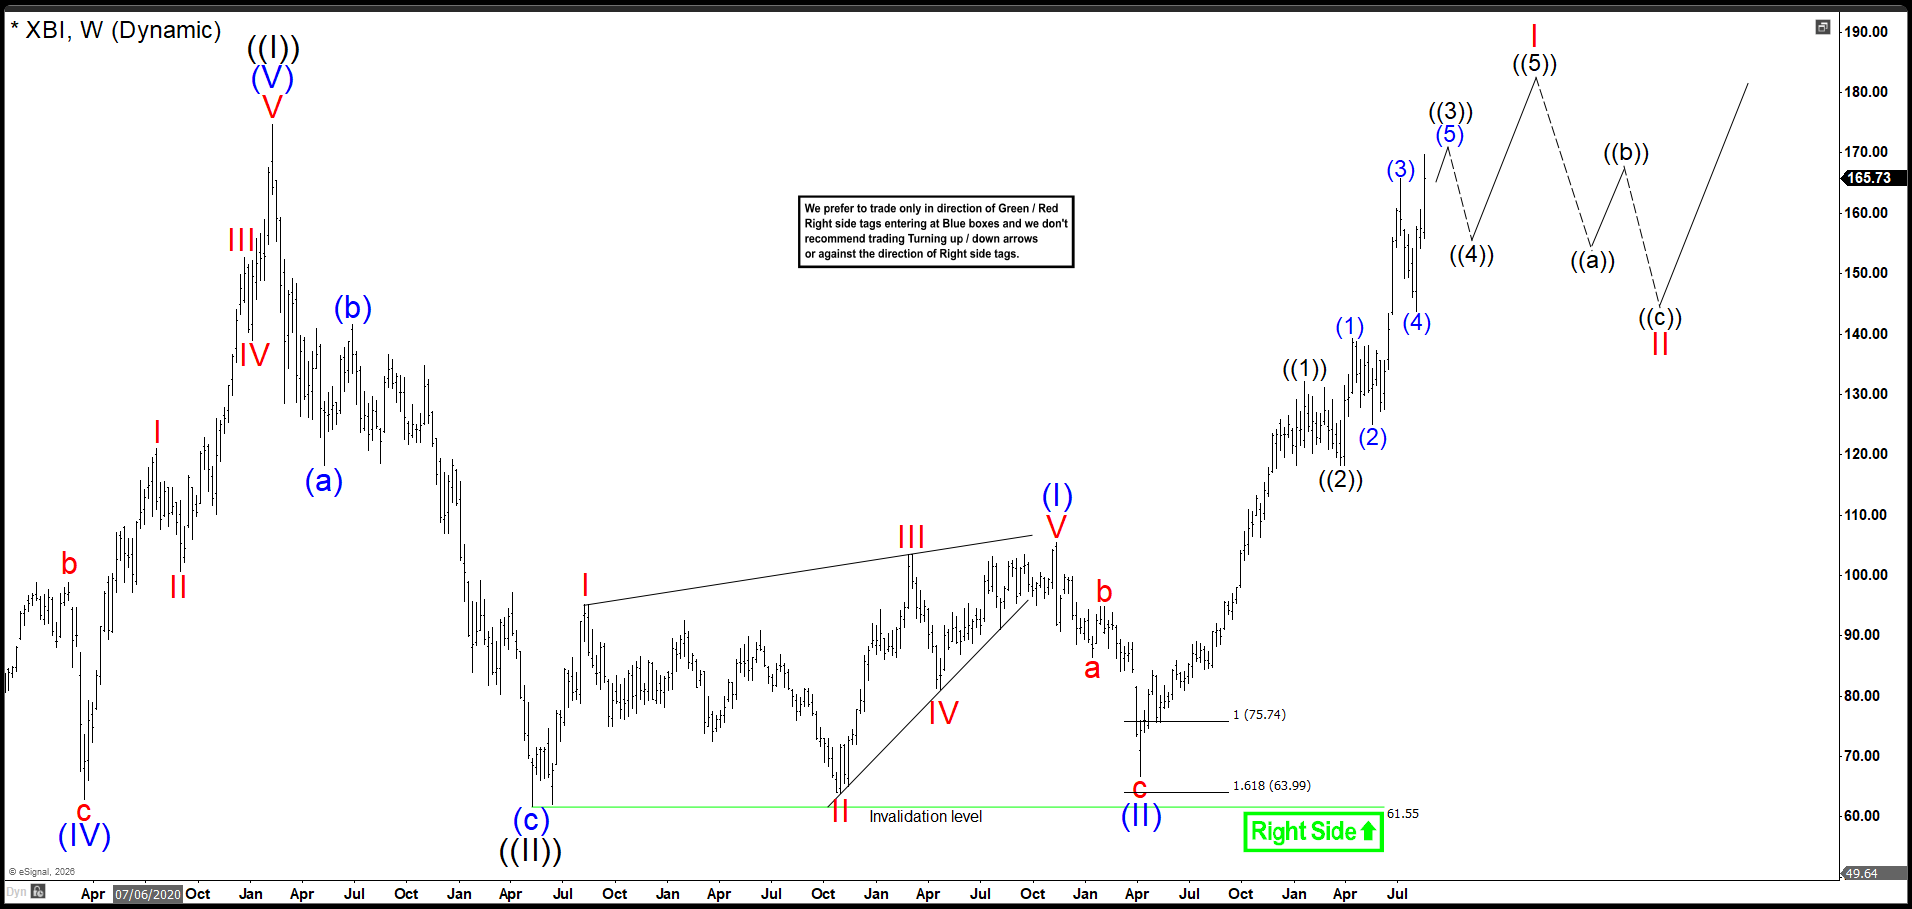
Unfortunately, investors never received better prices to buy XBI. Moreover, wave ((2)) ended extremely shallow. The bullish breakout erased any chance of seeing wave II, and wave I simply extended. This means we still have room to finish the impulse of wave I. Most likely, XBI will print new all‑time highs this year.
Now, wave ((3)) could be close to ending if no further extensions appear. Then, wave ((4)) should trigger a corrective pullback, possibly around September. Even so, we expect XBI to finish 2026 above current levels, completing the terminal impulse. Finally, the next pullback should not mark the end of wave I. Instead, we must wait for a clear bearish reaction after the full structure completes to confirm that wave II has started.
Transform Your Trading with Elliott Wave Forecast!
Ready to take control of your trading journey? At Elliott Wave Forecast, we provide the tools you need to stay ahead in the market:
Blue Boxes: Stay ahead in the market with fresh 1-hour charts updated four times daily, daily 4-hour charts on 78 instruments, and precise Blue Box zones that highlight high-probability trade setups based on sequences and cycles.
Live Sessions: Join our daily live discussions and stay on the right side of the market.
Real-Time Guidance: Get your questions answered in our interactive chat room with expert moderators.
🔥 Special Offer: Start your journey with a 14-day trial for only $0.99. Gain access to exclusive forecasts and Blue Box trade setups. No risks, cancel anytime by reaching out to us at support@elliottwave-forecast.com.




