

In our previous Elliott Wave update on the SPDR S&P Oil & Gas Exploration & Production ETF ($XOP), we highlighted two possible paths. The ETF could either hold the recent low and resume the bullish cycle from April 2025, or extend lower in a 7-swing correction toward the previously identified Blue Box Area.
Recent price action has now provided greater clarity. The 7-swing downside scenario has been negated, and the structure increasingly favors the bullish path. As a result, $XOP now looks poised to extend into new all-time highs, with the larger bullish sequence pointing toward $242+.
$XOP Negates the 7-Swing Correction
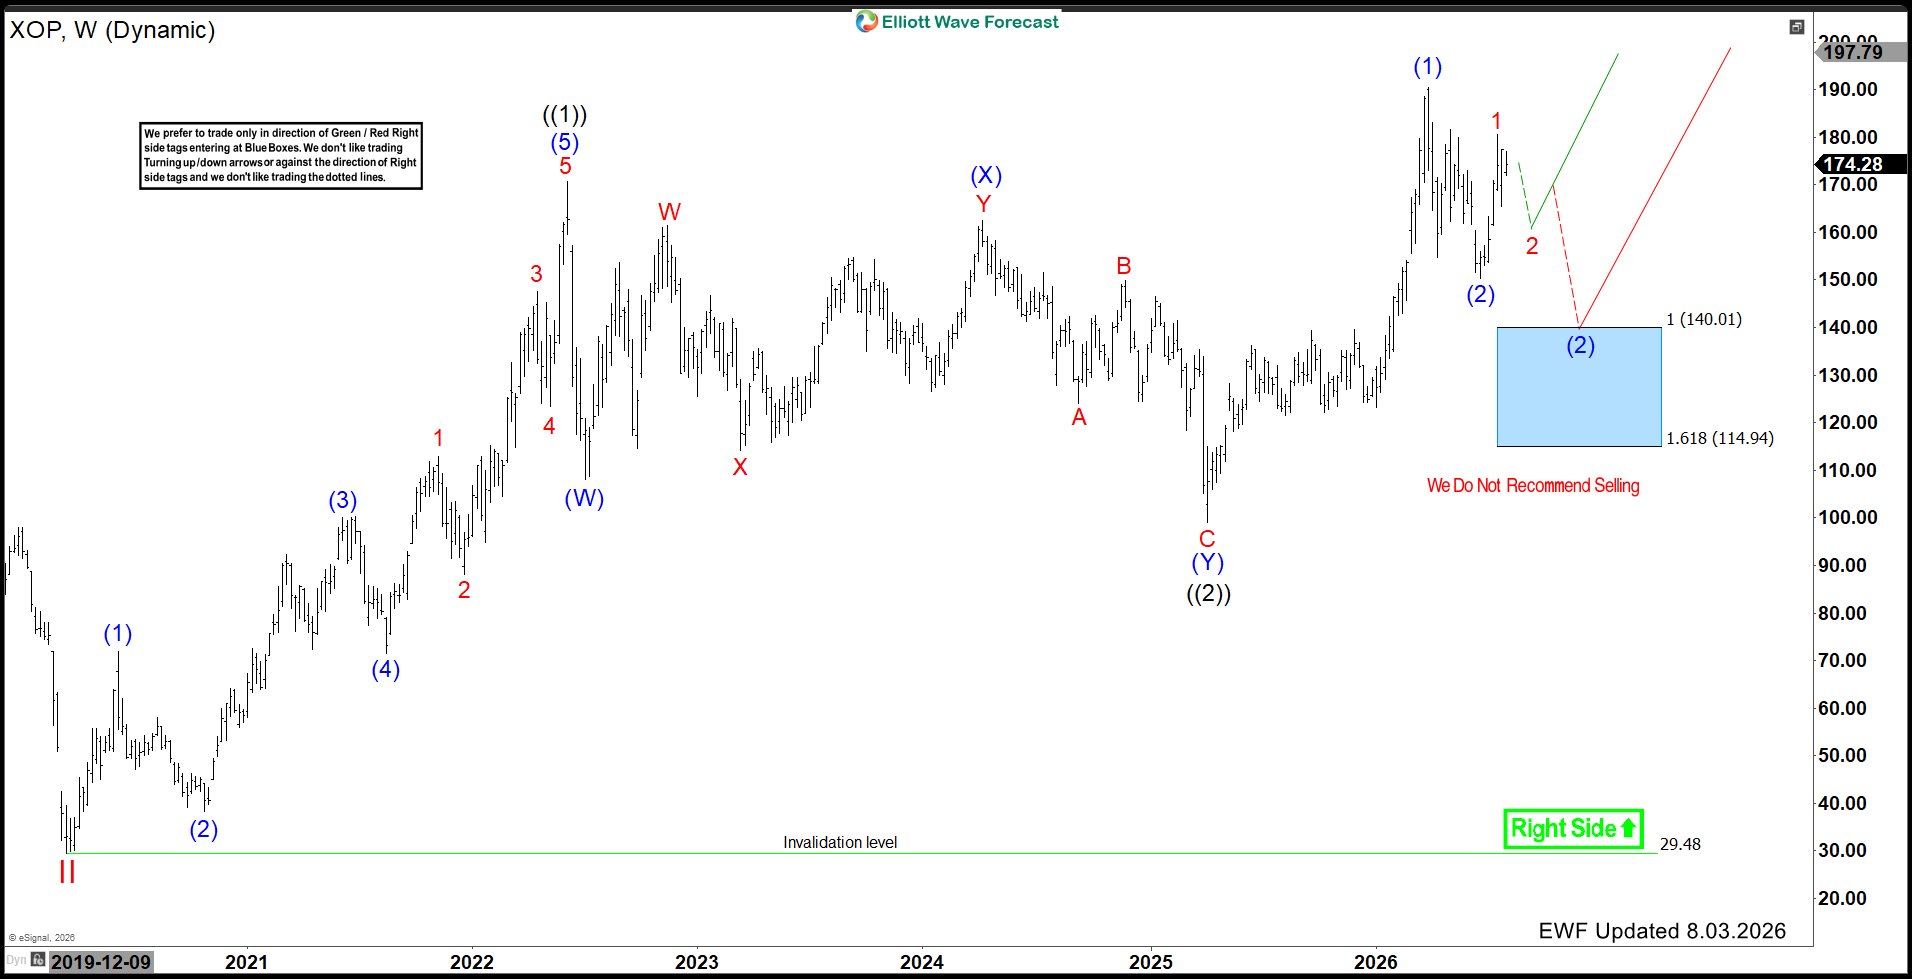
Previously, the possibility remained that the correction from the 2026 peak could develop into a larger 7-swing structure. Under that scenario, $XOP could have extended lower toward the 140.01–114.94 Blue Box Area before buyers entered.
However, the market did not follow that path.
Instead, $XOP held the recent corrective low and turned strongly higher. More importantly, the latest advance has changed the short-term sequence and removed the need for the deeper 7-swing decline.
Therefore, the previously highlighted Blue Box scenario is no longer the preferred view.
Recent Low Appears to Have Completed the Correction
The latest price action supports the idea that wave (2) already ended at the recent low. From there, $XOP has started to build another impulsive sequence to the upside.
This development is important because it fits perfectly with the larger double-nest structure from the 2020 lows. The April 2025 low completed another important corrective cycle, while the subsequent rally created a new bullish sequence.
Now that the latest correction appears complete, $XOP can begin the next expansion phase.
Double Nest From 2020 Continues to Favor the Bulls
The bigger picture remains the most important part of the analysis. From the 2020 low, $XOP continues to display a bullish double nest, which suggests that the long-term sequence remains incomplete to the upside.
Double nests often precede some of the strongest portions of an Elliott Wave advance. Multiple wave 1 and wave 2 structures build the foundation before price accelerates in a higher-degree third wave.
Consequently, the recent bullish resolution adds weight to the idea that $XOP can now enter a stronger trending phase rather than continue sideways or lower.
New All-Time Highs Become the Next Objective
With the bearish alternative negated, attention now shifts toward the previous record high.
A continuation above that level would confirm that the bullish cycle remains firmly in progress and open the next phase of the advance. From there, the larger sequence points toward $242+ as the next meaningful upside objective.
Therefore, new all-time highs should not necessarily be viewed as the end of the move. Instead, a breakout can act as confirmation that the next bullish leg has started.
Why $242+ Is in Focus
The Elliott Wave structure suggests that $XOP still has an incomplete bullish sequence from the larger 2020 and April 2025 lows. Consequently, the next expansion can carry price well beyond the previous peak.
The $242+ area represents the next important upside region as that sequence develops. Of course, the ETF will likely experience smaller pullbacks along the way. However, those corrections should remain supported while the larger bullish structure stays intact.
For that reason, the preferred strategy remains to favor corrective pullbacks rather than chase bearish setups against the dominant trend.
Near-Term Outlook for $XOP
In the short term, $XOP can continue to advance toward its previous high. Once that level breaks, the structure should confirm another bullish extension and strengthen the case for $242+.
Temporary pullbacks can still occur as individual waves complete. Nevertheless, those dips should remain corrective as long as the recent key low continues to hold.
The important change from our previous outlook is clear: the market has negated the expected 7-swing decline and shifted the preferred path firmly back to the upside.
Technical Summary
To summarize, $XOP has negated the previously highlighted 7-swing downside scenario. Rather than extending into the 140.01–114.94 Blue Box Area, the ETF held its recent low and resumed higher.
This price action supports the view that the correction already ended and that the larger double-nest bullish sequence from the 2020 lows remains in control.
The next objective is a move into new all-time highs. Once that breakout occurs, the bullish sequence can continue extending toward $242+, making the coming quarters potentially important for the next stage of $XOP’s long-term advance.


