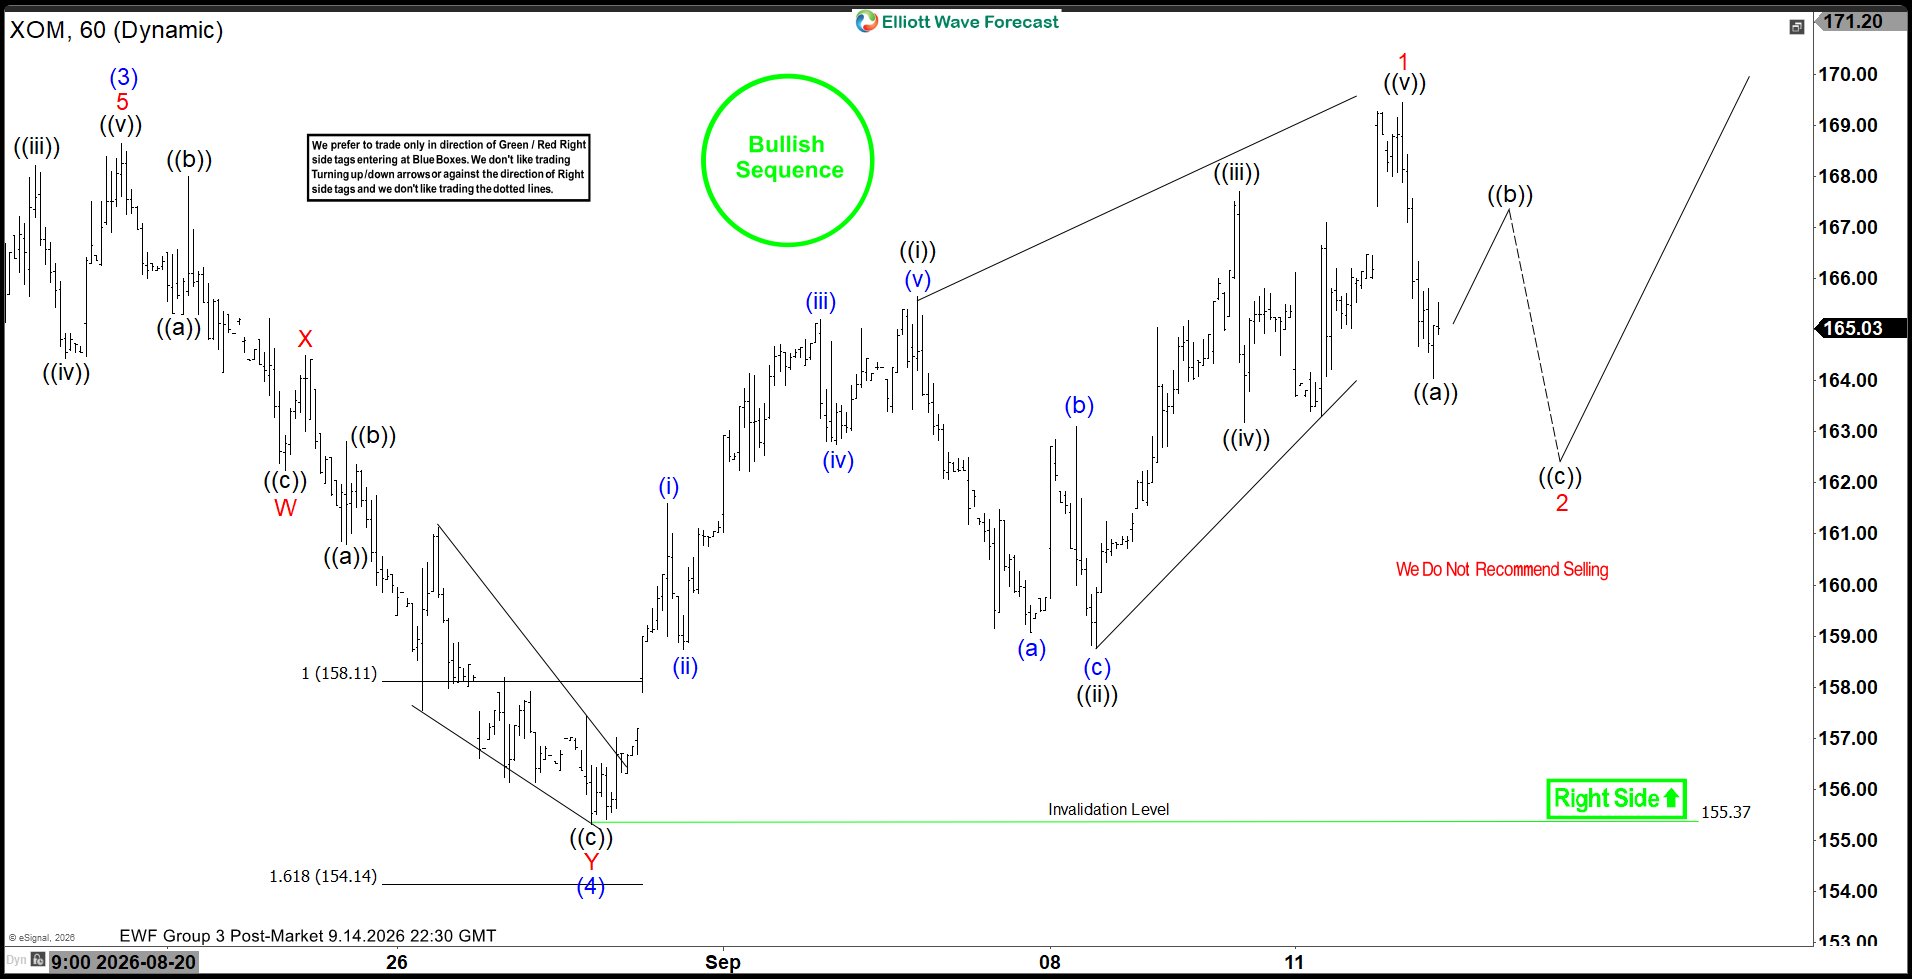
The short‑term Elliott Wave outlook for Exxon Mobil (XOM) indicates that the rally from the June 25, 2026 low is unfolding as a five‑wave diagonal. From that point, wave (1) concluded at $159.42, followed by a corrective pullback in wave (2) that ended at $149.09. The stock then advanced in wave (3), reaching $168.64. The subsequent pullback in wave (4) developed as a double three structure, with wave W finishing at $162.25, wave X rallying to $165.40, and wave Y declining to $155.37. This sequence completed wave (4) at a higher degree.
The advance has since resumed in wave (5). Within this leg, the rally unfolded as a diagonal. Wave ((i)) ended at $165.65, while the dip in wave ((ii)) terminated at $158.75. The third wave, ((iii)), carried prices higher to $167.70, before a modest pullback in wave ((iv)) concluded at $163.18. The final push in wave ((v)) reached $169.45, thereby completing wave 1 of a higher degree. At present, expectations favor a corrective pullback in wave 2. This retracement is anticipated to correct the cycle from the August 28, 2026 low, likely unfolding in either three or seven swings before the rally resumes.