

Robinhood (NASDAQ: HOOD) established a major weekly low in early 2026. The stock is now starting a new cycle to the upside. In today’s article, we examine the daily Elliott Wave structure unfolding from the lows. Our analysis explores the potential bullish path ahead.
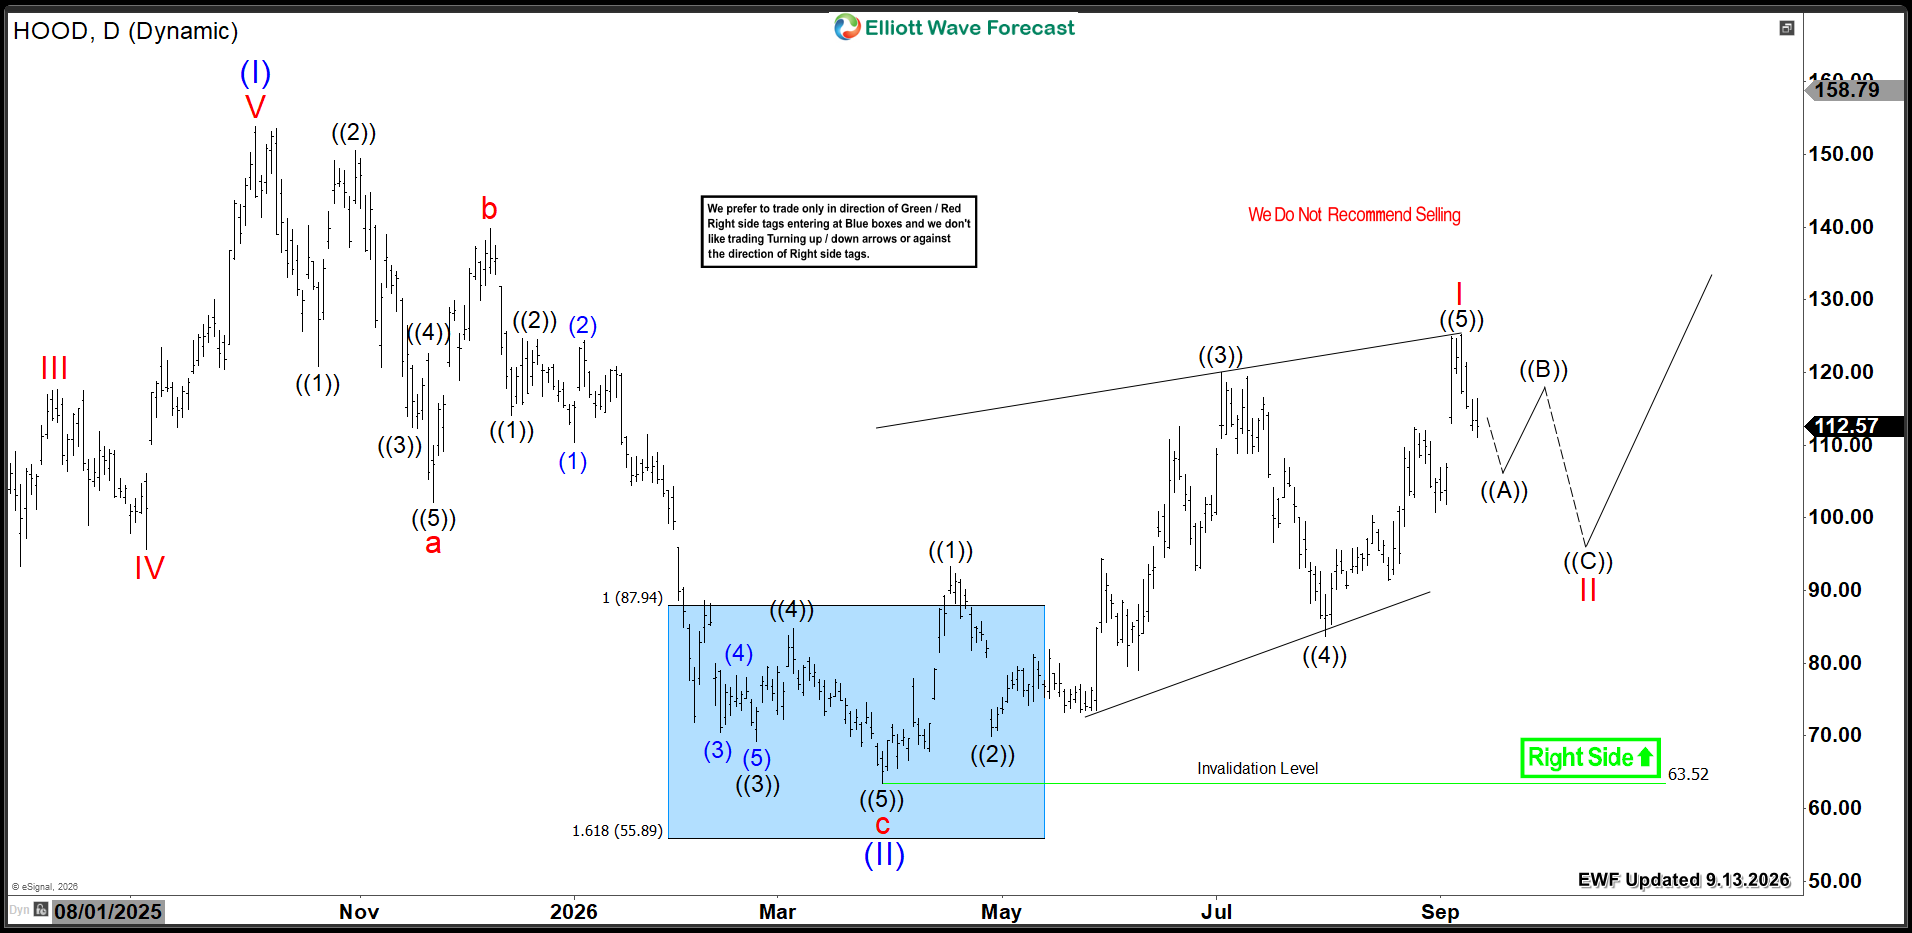
Our earlier analysis identified Robinhood’s (NASDAQ: HOOD) extreme buying zone at $87 – $55. The stock completed a three-wave zigzag from its 2025 peak. This decline reached the equal legs area at $63.52. Following that, HOOD started a new cycle to the upside. It formed a five-swing structure, creating a leading diagonal at the wave I peak of $125.25.
Consequently, a wave II pullback should unfold as 3, 7, or 11 swings. This correction must hold above the March 2026 low. Afterwards, the stock will resume its bullish trend in wave III. It will break above the October 2025 peak. The upside target within the weekly cycle takes Robinhood toward $210 – $301. Then, another major pullback will occur.
HOOD Daily Chart 9.13.2026
Conclusion
HOOD‘s larger-degree bullish cycle remains firmly intact. Therefore, investors should target buying opportunities within daily pullbacks.
Get More Insights Today
Learn to trade our Blue Boxes using the 3, 7, or 11 swings sequence. Try our services with a 14-day trial.
You will gain access to:
-
78 instruments updated across 4 different time frames
-
Live Trading & Analysis Sessions with our Expert Analysts every day
-
24-hour chat room support and much more
Explore our system to gain deeper insights into this methodology.


