Our earlier analysis identified Robinhood’s (NASDAQ: HOOD) weekly correction. Now, we examine the daily Elliott Wave structure. This review clarifies the current pullback and prepares for the next strategic phase before a new bullish cycle begins.
Elliott Wave Analysis
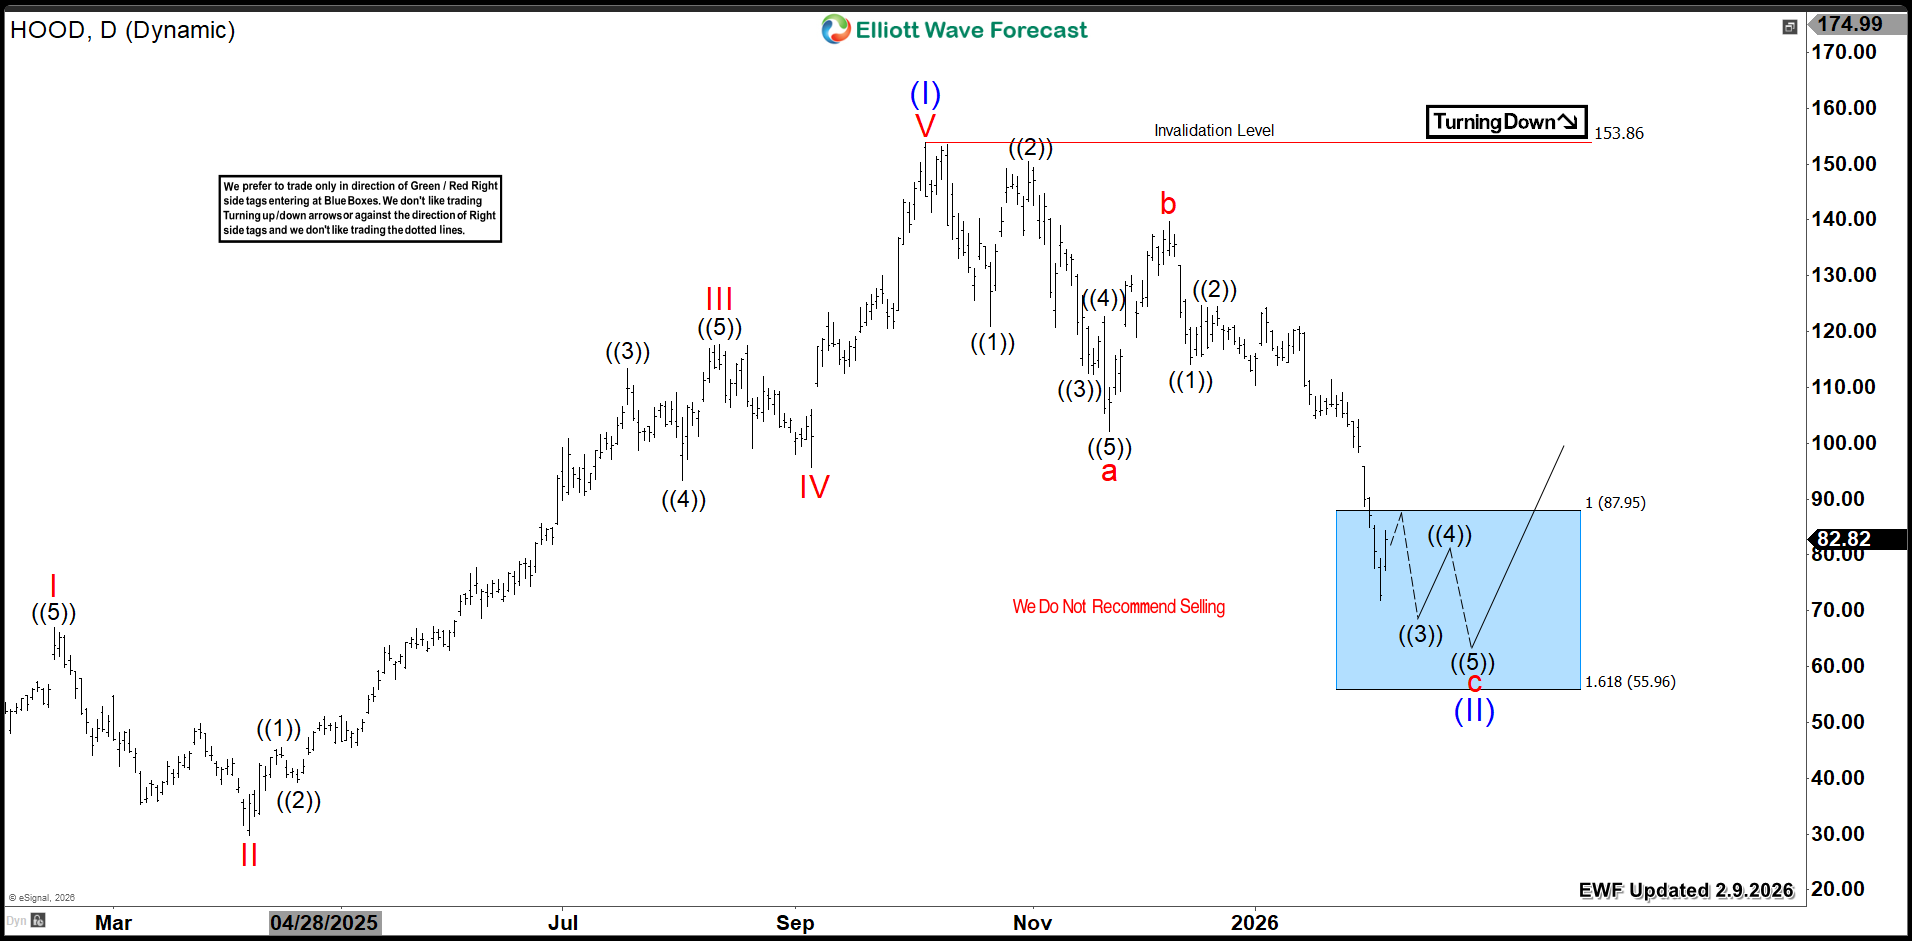
HOOD Daily Chart 2.9.2026
Conclusion
HOOD‘s core weekly uptrend remains firmly bullish. Therefore, traders should target strategic entries during daily pullbacks. Apply our Elliott Wave methodology for precise timing. More precisely, enter the market after a 3, 7, or 11-swing correction finishes. Additionally, our proprietary Blue Box system identifies high-probability reversal zones. This disciplined approach provides clarity and confidence. Ultimately, it positions you to capture the next major advance.


