Micron (MU) delivered a strong second quarter because AI memory demand expanded rapidly. Moreover, revenue exceeded expectations, which boosted institutional confidence. However, the market reacted cautiously since memory pricing remains highly cyclical. Therefore, analysts expect continued volatility while Micron manages inventories and increases capacity.
Even so, the consensus stays bullish because AI supports a favorable long‑term cycle. Additionally, several banks project higher prices if HBM demand accelerates further. Consequently, the stock could resume its upward trend once margins stabilize. Finally, investors monitor costs and production plans to confirm sustained momentum.
Elliott Wave Outlook: MU Daily Chart November 2025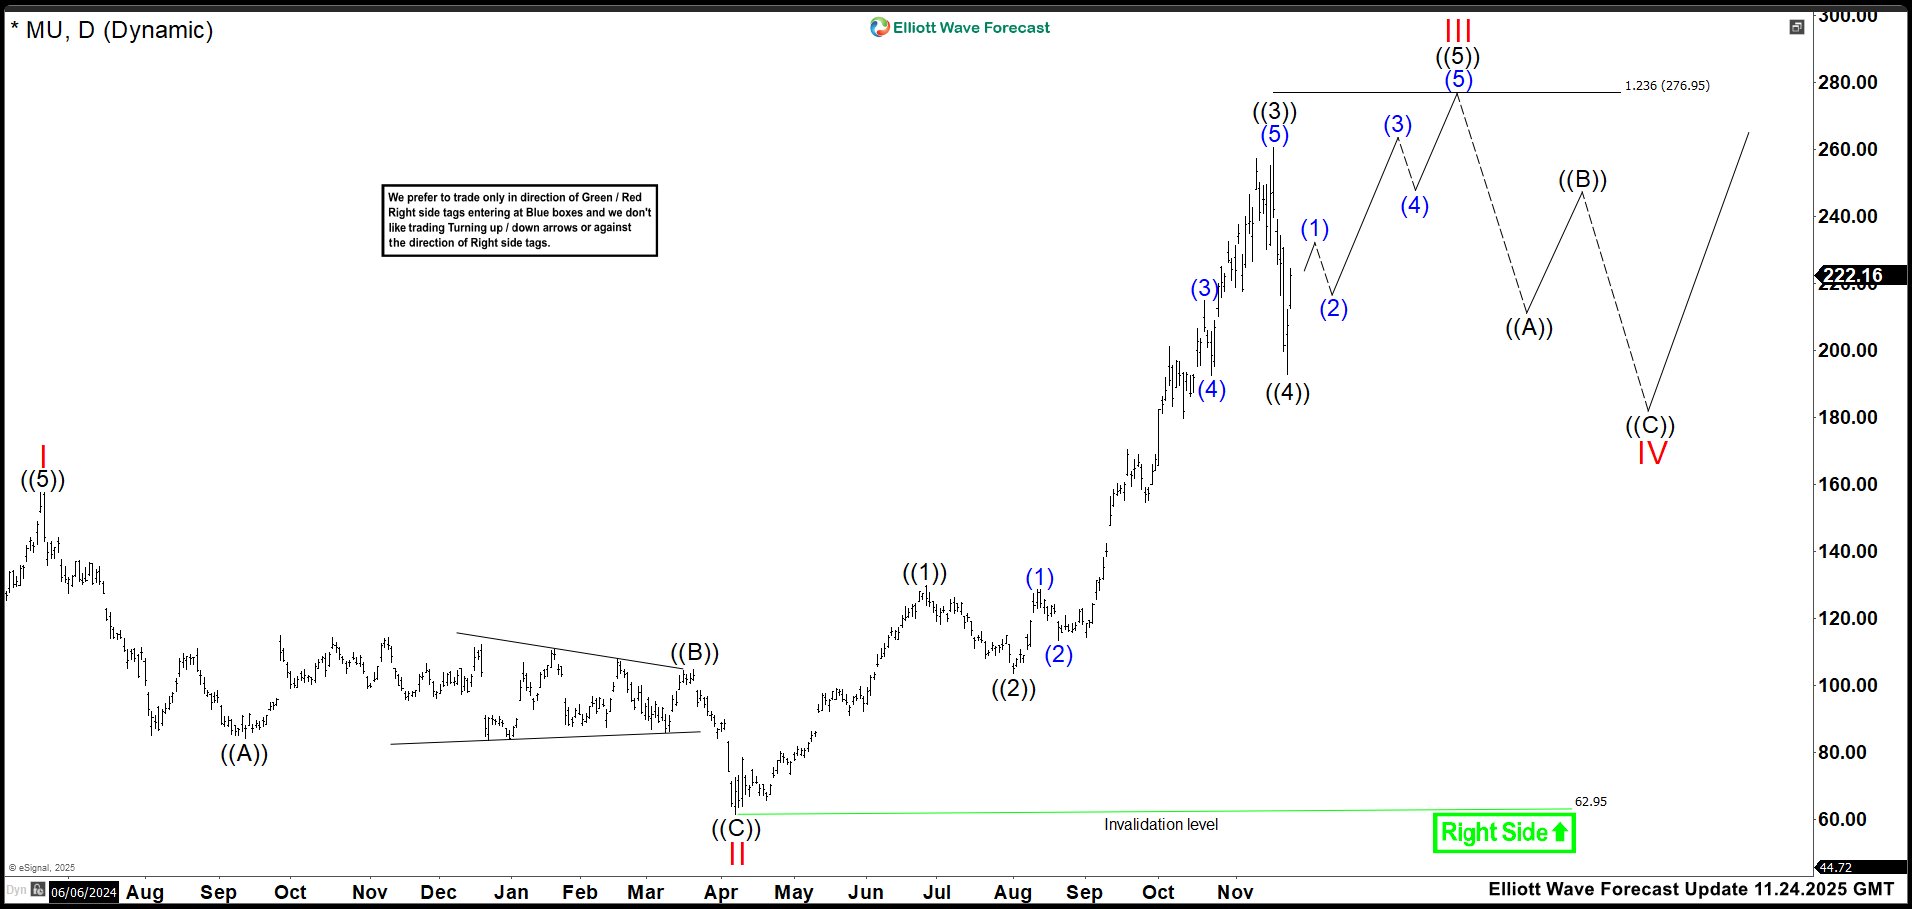
In the November update, MU maintained an impulsive structure and advanced with strong momentum. Then wave ((1)) ended at 129.96, and a correction followed toward 102.94. From that level, wave ((3)) began extending with increasing strength. As expected, wave ((3)) pushed higher and reached 261.03 in November. Afterward, MU dropped sharply to 192.58 over four days, which defined wave ((4)).
Looking ahead, the minimum target stood at 276.95, and price could extend if momentum persisted. Moreover, MU needed to break above 261.03 to complete wave ((5)) of III. This target did not signal an immediate short opportunity because the trend remained bullish. Instead, the level served as a projection, not a reversal trigger. Ultimately, MU could continue rising before any major correction develops. (If you want to learn more about Elliott Wave Principle, please follow these links: and .)
Elliott Wave Principle Behind the Market Structure
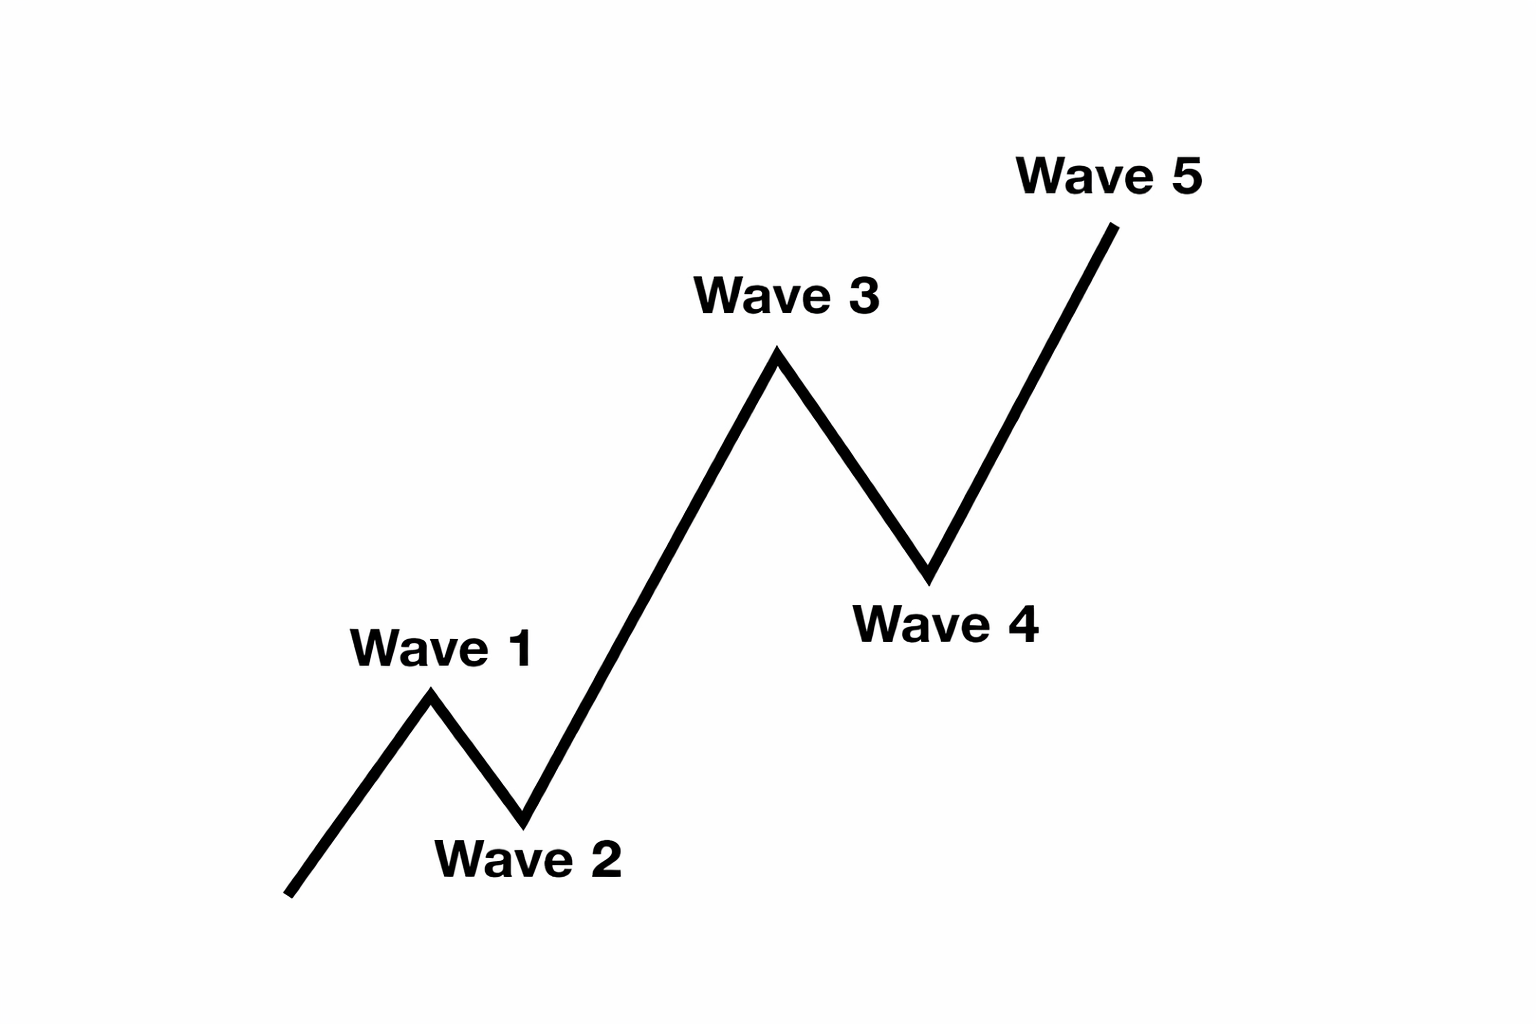
Impulse
An impulse is a clean 5‑wave pattern that drives the trend forward.
- Waves 1‑3‑5 are strong and directional.
- No overlap between waves 1 and 4.
- Wave 3 is usually the strongest.
- Structure is clear, with increasing momentum.
Elliott Wave Outlook: MU Daily Chart April 2026

In this update, MU not only broke above 300 but also extended toward 480 in a strong rally. Therefore, we adjusted the count from the April wave II low. Given the impulsive structure, we see two possible scenarios. First, the impulse from wave II may represent a new wave ((1)), and the market now develops wave ((2)). This view suggests wave (A) of ((2)) already ended, and MU currently advances in wave (B) of ((2)). We expect a move toward 406.46–447.93, where MU could reverse and start wave (C) of ((2)).
The second scenario proposes that the impulse from the April low is wave III, and the March correction is wave IV. Under this view, MU should break above the wave III high to complete wave V of (I). Ultimately, everything depends on the reaction inside the 406.46–447.93 area. Any strong rejection there could trigger a deeper decline. For now, price action still favors more upside against the wave IV low toward the 406.00 region.
Transform Your Trading with Elliott Wave Forecast!
Ready to take control of your trading journey? At Elliott Wave Forecast, we provide the tools you need to stay ahead in the market:
Blue Boxes: Stay ahead in the market with fresh 1-hour charts updated four times daily, daily 4-hour charts on 78 instruments, and precise Blue Box zones that highlight high-probability trade setups based on sequences and cycles.
Live Sessions: Join our daily live discussions and stay on the right side of the market.
Real-Time Guidance: Get your questions answered in our interactive chat room with expert moderators.
🔥 Special Offer: Start your journey with a 14-day trial for only $0.99. Gain access to exclusive forecasts and Blue Box trade setups. No risks, cancel anytime by reaching out to us at support@elliottwave-forecast.com.
💡 Don’t wait and get a DISCOUNT for any plan!
Click in the next link, go to Home Chat and ask for a flat discount code saying that you saw this in Luis’ Blog: 🌐


