

Hello Traders, in today’s blog post we are reviewing the $META wave structure shared with our members, which pointed to a bullish reversal. The Elliott Wave Zigzag pattern confirmed the move just above the critical 518.21 invalidation level, propelling prices sharply higher. Read on as we break down what lies ahead for the stock.
The Corrective Pullback Forecast
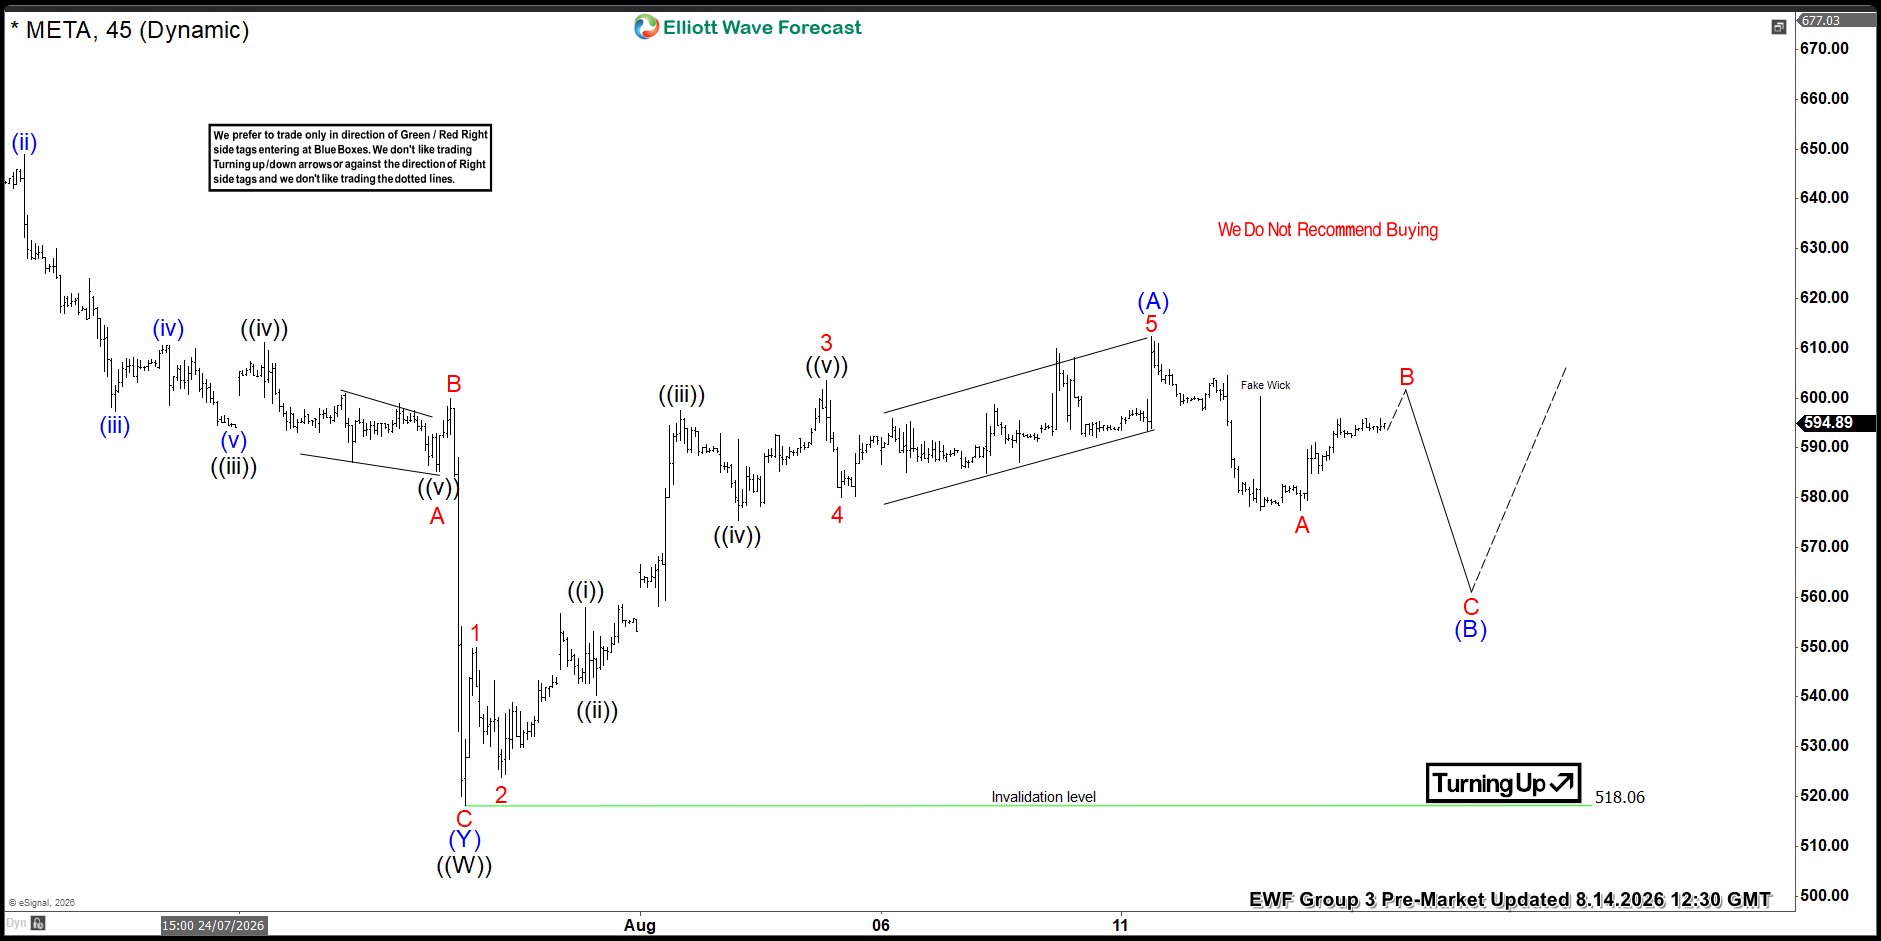
The chart from 08.14.2026, highlighted a completed impulsive rally in wave (A), followed by a 5-swing structure in wave A. This 5-swing decline signalled that the market was developing a classic 5-3-5 Zigzag correction. Based on this structure, the forecast called for a final push higher in wave B—holding below the wave (A) high—before turning lower in wave C of (B).
What is a ZigZag Correction?
A Zigzag structure in Elliott Wave Theory is a sharp three‑wave corrective pattern labelled A‑B‑C, with a distinct 5‑3‑5 subdivision. It represents a counter‑trend move and is one of the most common corrective formations.
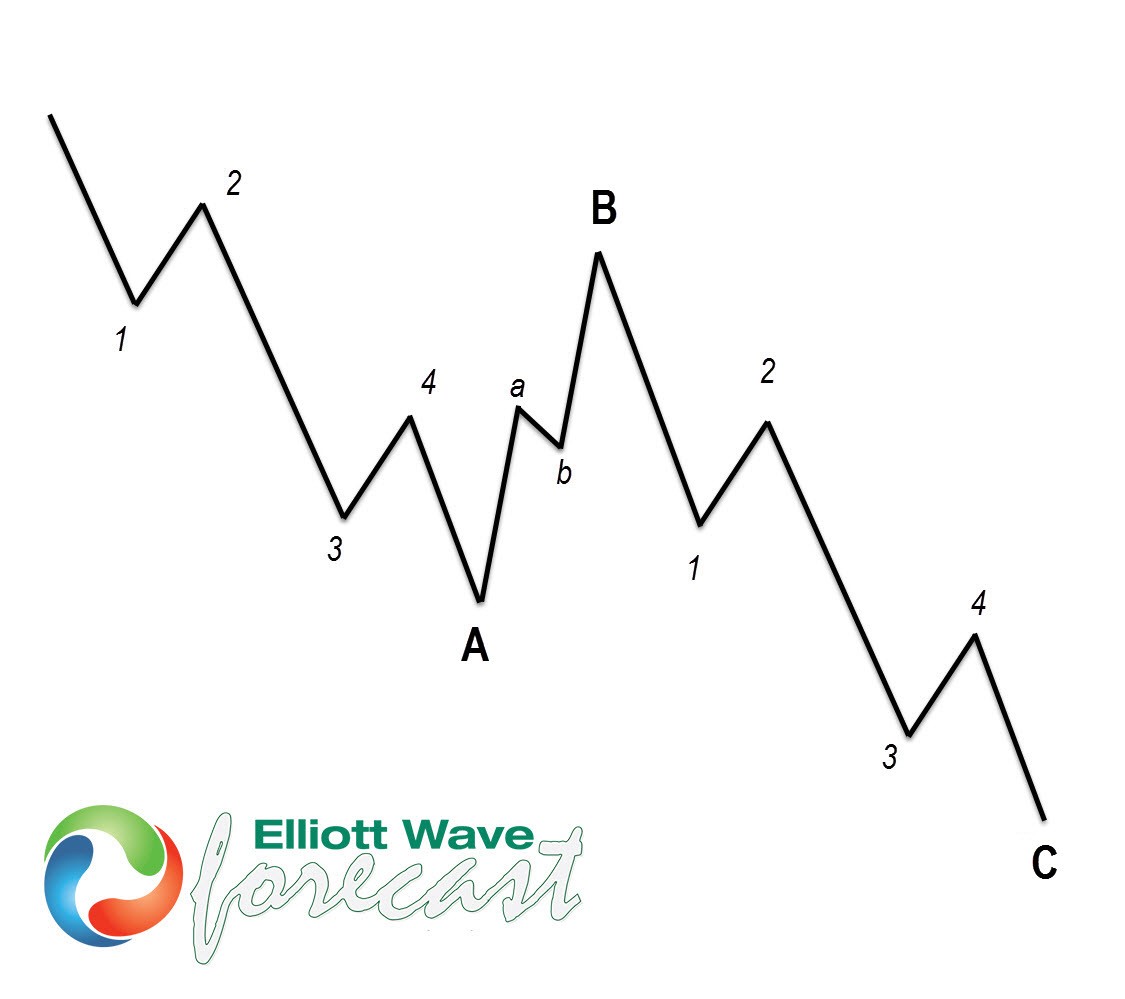
Wave A: Comprises 5 sub-waves (impulsive structure indicating the primary trend of the correction).
Wave B: Comprises 3 sub-waves (a corrective counter-move against Wave A).
Wave C: Comprises 5 sub-waves (a final impulsive move, typically equal to or longer than Wave A).
Trading Insights
- Zigzags often signal continuation after correction, making them useful for identifying re‑entry points in the direction of the larger trend.
- Traders watch for Blue Box zones (high‑probability reversal areas) to align entries with the end of Wave C.
- Recognizing zigzags helps avoid mistaking them for trend reversals—they are corrective pauses, not new dominant trends.
Now that we understand what a Zigzag correction is, we can clearly connect that concept to the corrective structure shown in the META chart above
Wave B complete & Turn Lower in C wave
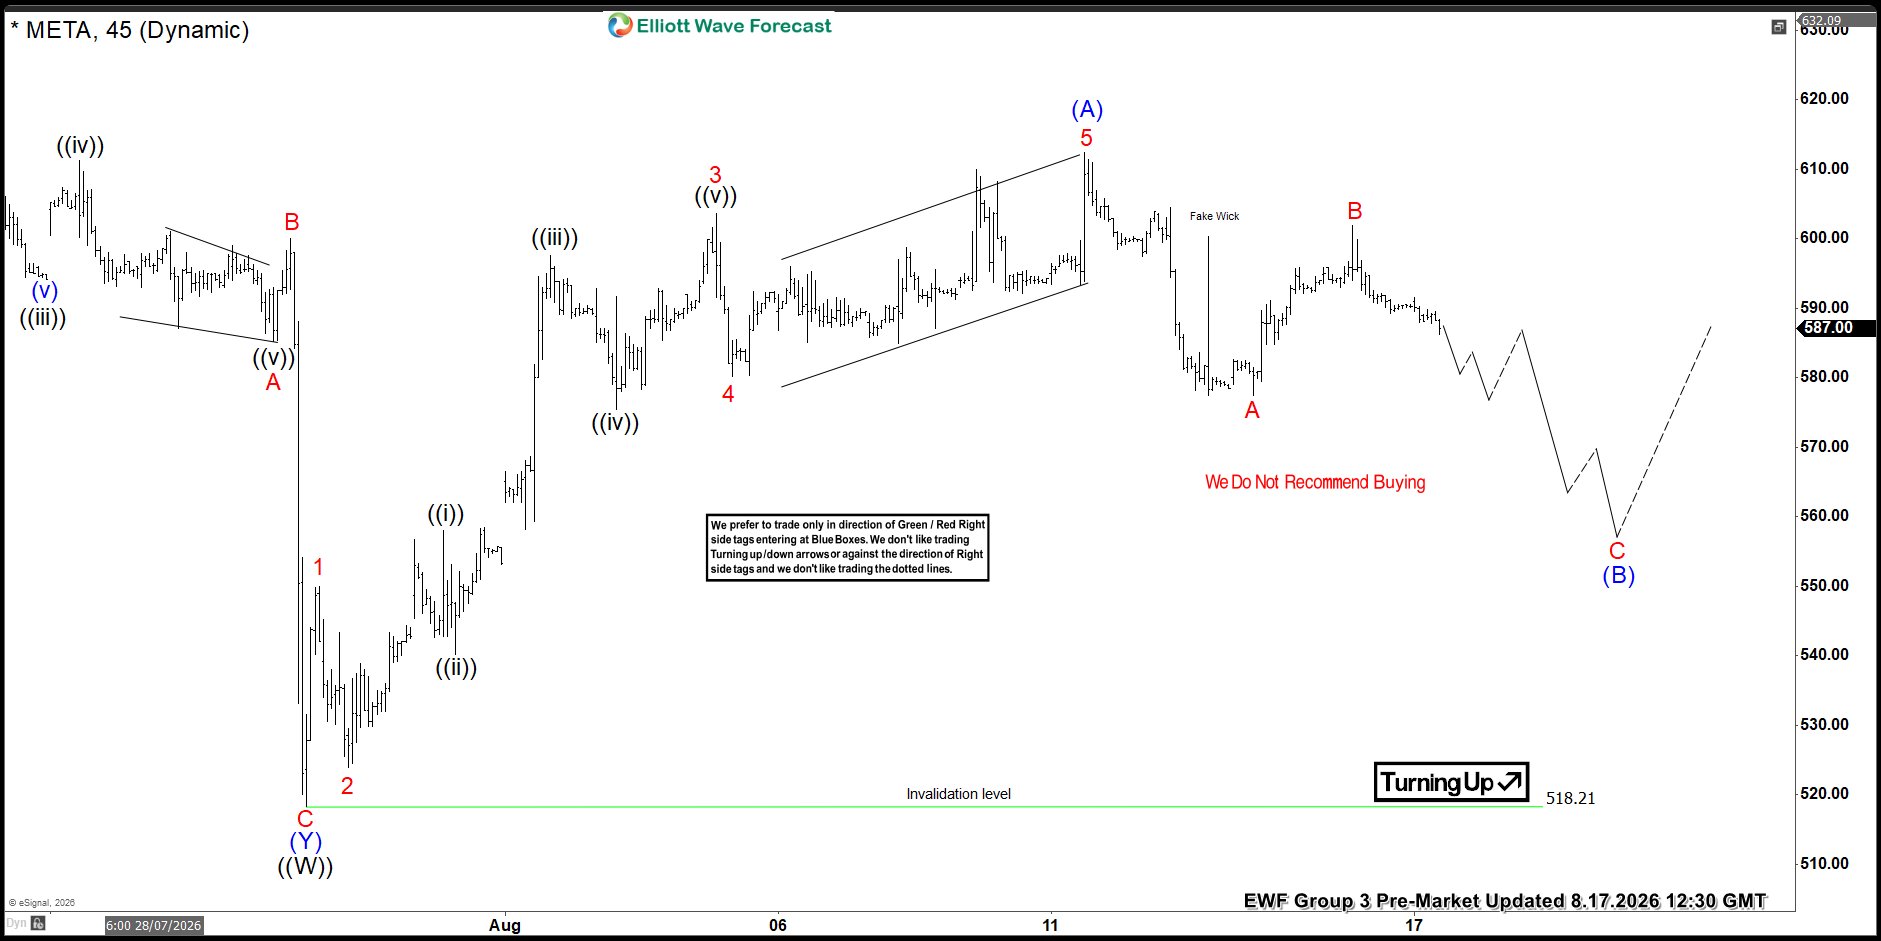
Fast-forwarding to the 08.17.2026 chart below, the wave B correction ended just below the peak of wave (A). Prices turned lower as expected and are currently trading within wave C to complete wave (B). This pull-back should mature above the key invalidation level at 518.21 to keep the bullish forecast intact for a turn higher upon completion. A break below 518.21 invalidates the entire wave count.
Wave (B) Reaching Maturity
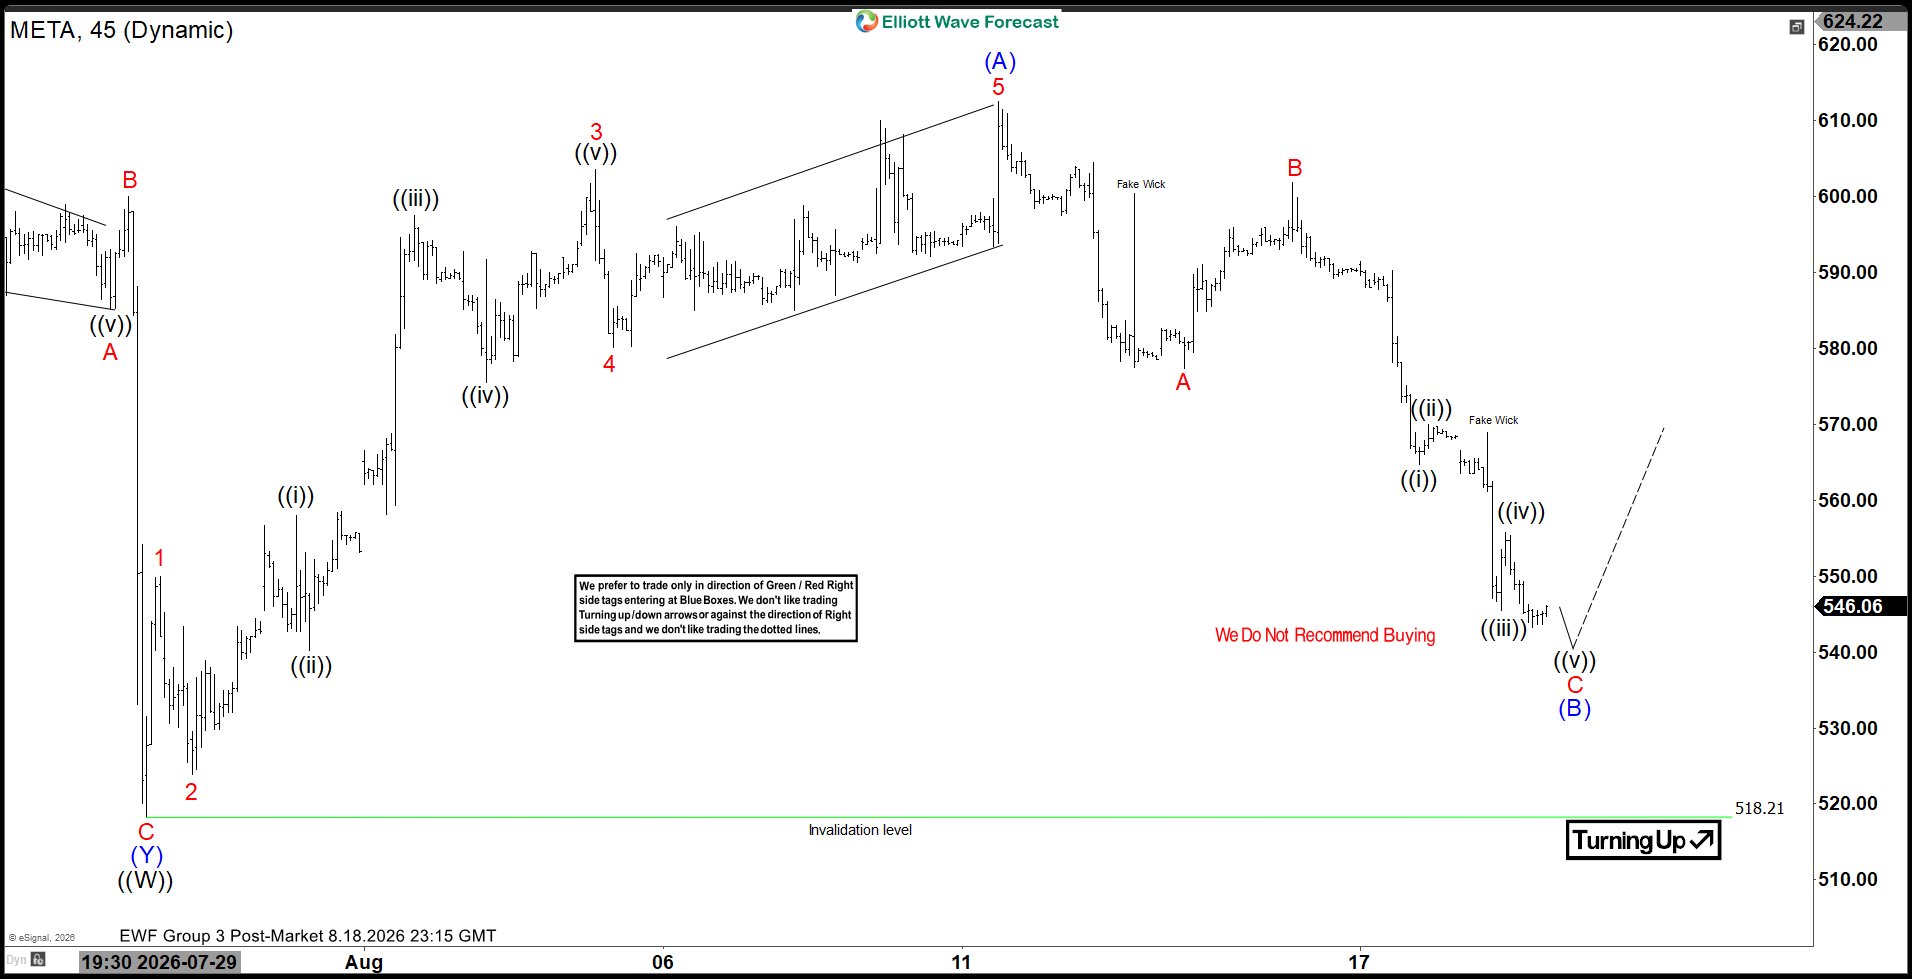
Moving forward to the 08.18.2026 chart below, wave C developed a 5-swing micro-structure, signalling to traders that the decline was reaching maturity and to prepare for a turn higher. As expected, price held cleanly above the key 518.21 swing low to initiate the reversal.
Wave (C) of ((X)) Rally Initiated: Key Targets & What’s Next
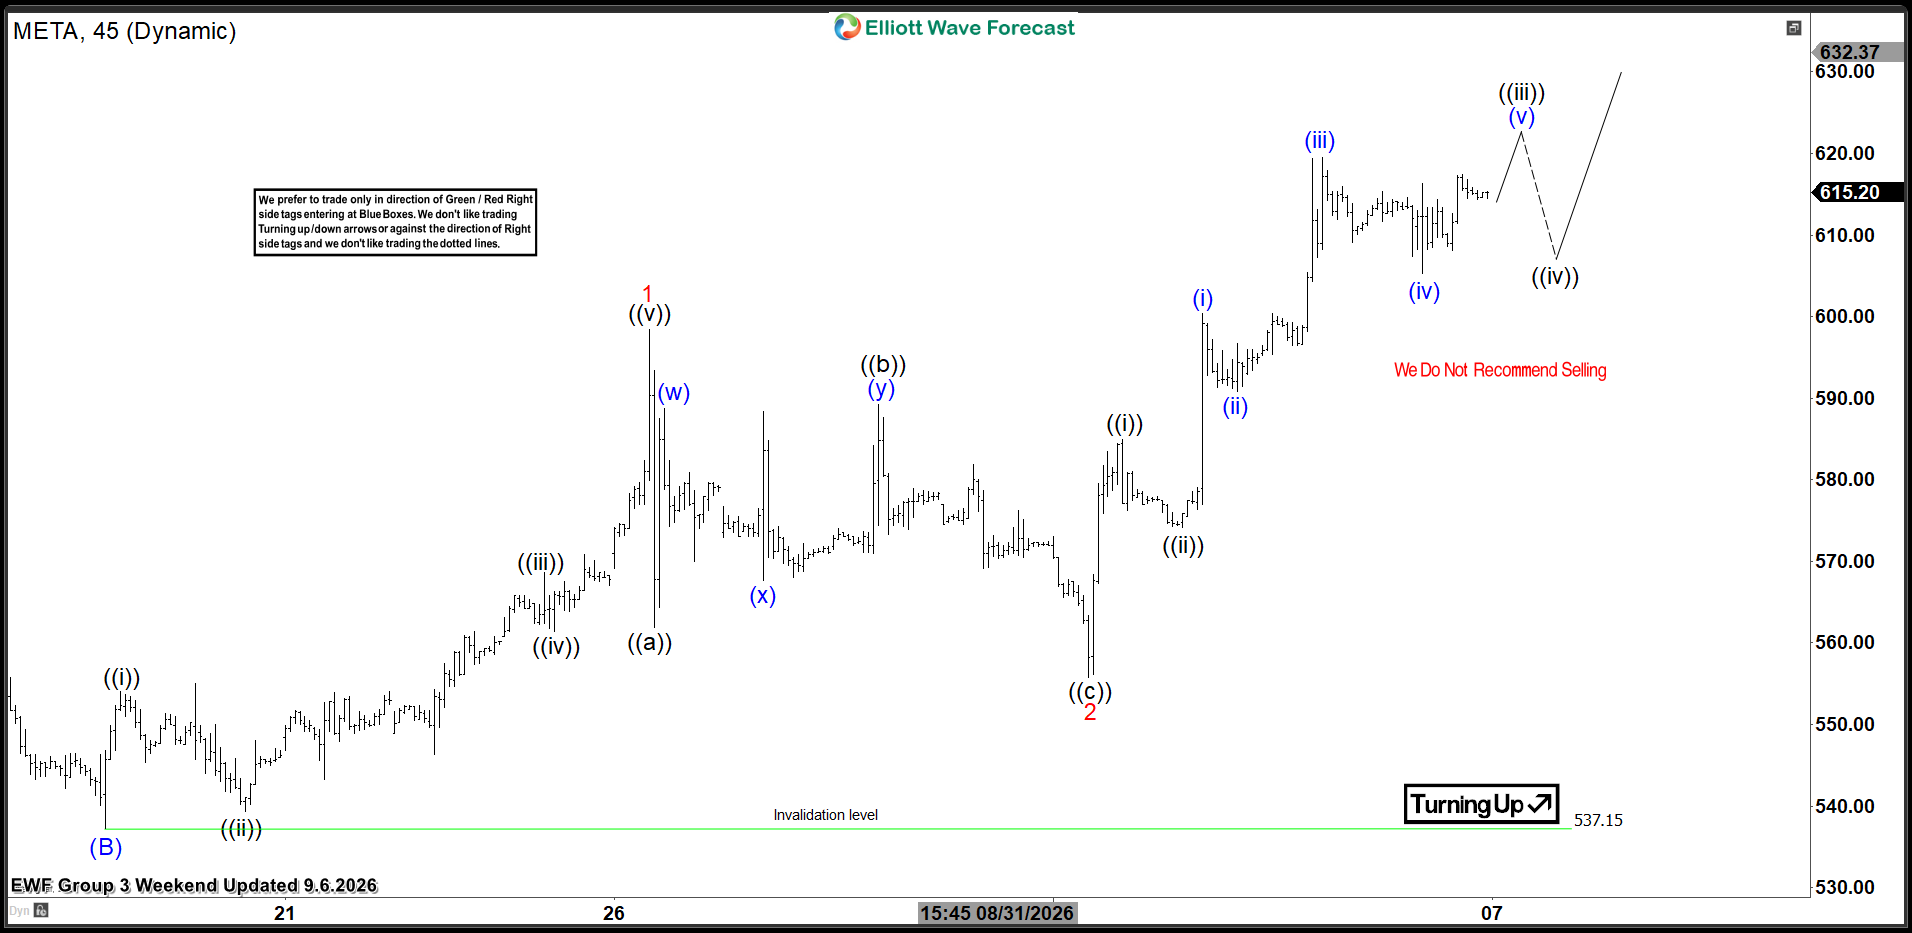
The latest update chart from 09.06.2026 below, shows a reaction higher following the completion of wave (B), with waves 1 and 2 now in place. Price action continues to track the forecast as wave (C) of ((X)) progresses. Looking ahead, expect one more swing higher to complete wave ((iii)), followed by a minor wave ((iv)) pullback and a final push in wave ((v)) to finish wave 3. From there, a 3- or 7-swing correction in wave 4 should hold above the wave 2 low, setting up wave 5 of (C) to complete wave ((X)) within the 632.04 – 654.38 target zone. Selling pressure is expected in that area below the 691.84 invalidation mark, pointing toward an eventual major decline toward 416.03 – 245.45.
Why choose EWF ?
At Elliottwave Forecast (EWF), we deliver consistent market updates through regular charts update. Our analysts update 1‑hour charts four times daily and 4‑hour charts once per day across all 78 instruments. In addition, we host five live sessions each day and maintain a 24‑hour chatroom, providing clients with real‑time market guidance and answers to any questions they may have.
You can start a 14‑day trial with us today here and cancel anytime by emailing support@elliottwave-forecast.com
Follow on X @NgcoboGen


